Data Tables in DevResults allow you to directly upload spreadsheets of individual-level records and other raw data like tables of organizations, policies, and events. Data tables can have as many columns as you want, including text fields that allow you to store additional qualitative information for each row. On this page:
- Data table overview and requirements
- Creating a data table by designing it online
- Creating a data table by uploading a spreadsheet
- Creating a data table via an integration
- Creating a data table from a custom query
- Calculated columns
Data table overview and requirements
Data tables enforce good data practices. Columns in data tables are defined with types that only allow certain inputs. Columns for projects, disaggregation categories, and geographic places use drop-downs to select those fields. Columns for dates, numbers, and true/false restrict data entry to those kinds of values.
Partners can access and edit data tables if you so choose, but only the rows of data that are associated with their projects. Any information added by a partner will be automatically labeled with their project. Partners cannot see rows of data entered by others' projects. Click here to learn more about How Projects are Linked to Data Tables.
Data tables can serve as stand-alone repositories of information or databases, or they can be set to pull indicator results from these tables. In fact, data tables can inform multiple indicators. For a quick breakdown on when to use data tables or direct entry indicators, take a look at the Indicator Guidebook.
If you want to pull indicator data from a data table, you must have a minimum set of fields for the data to be well-defined:
- Date: Your data table must have a column for date. The date is used to associate each row with a reporting period.
- Place: If records in the data table are associated with geographic places, you must include a column for the type of geographic place the records relate to, such as location, district, or country. (If you don't include a geography column, any data from the table will be associated with your top-level administrative division, like the whole world or the whole country.)
- Project: If the records in the data table are attributable to projects, you must include a project column to label each record with the relevant project. Exceptions include national-level indices (such as literacy rate, which don't represent work attributable to one of your projects) or internal metrics (like staff or budget records).
- A column for what you're counting: Are you counting trainees? You'll need a column to list each trainee's ID or pseudonym. Patients? You'll need a column for each patient's ID or pseudonym. Are you counting dollars or euros? You'll need a column to enter those values. Note that you can also use calculated columns.
- A column for each disaggregation of any indicators that pull from this table: If you're disaggregating by gender, the column heading would be "Gender", and the rows in that column could contain "Male", "Female", etc. You would not have separate columns for each gender.
Creating a Data Table by Designing it Online
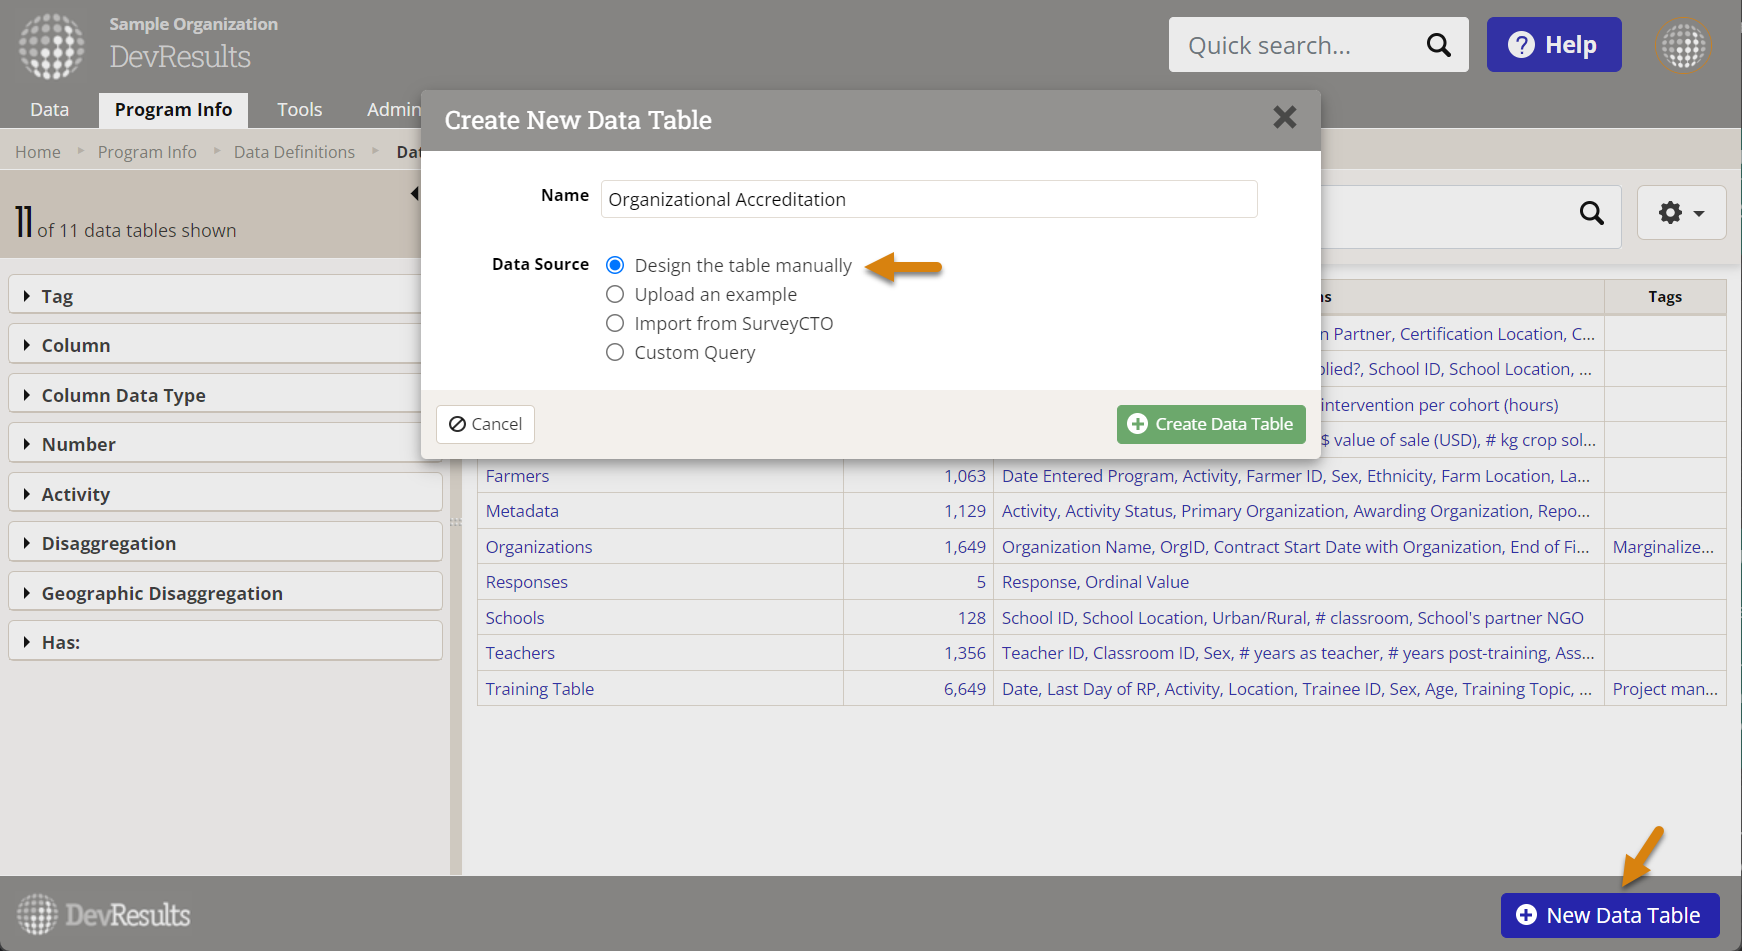
To create a data table online, navigate to the Data Tables page (Program Info > Data Definitions / Data Tables) and click on the blue (+) New Data Table button. Enter a name for your data table and select Design the table manually as your data source.
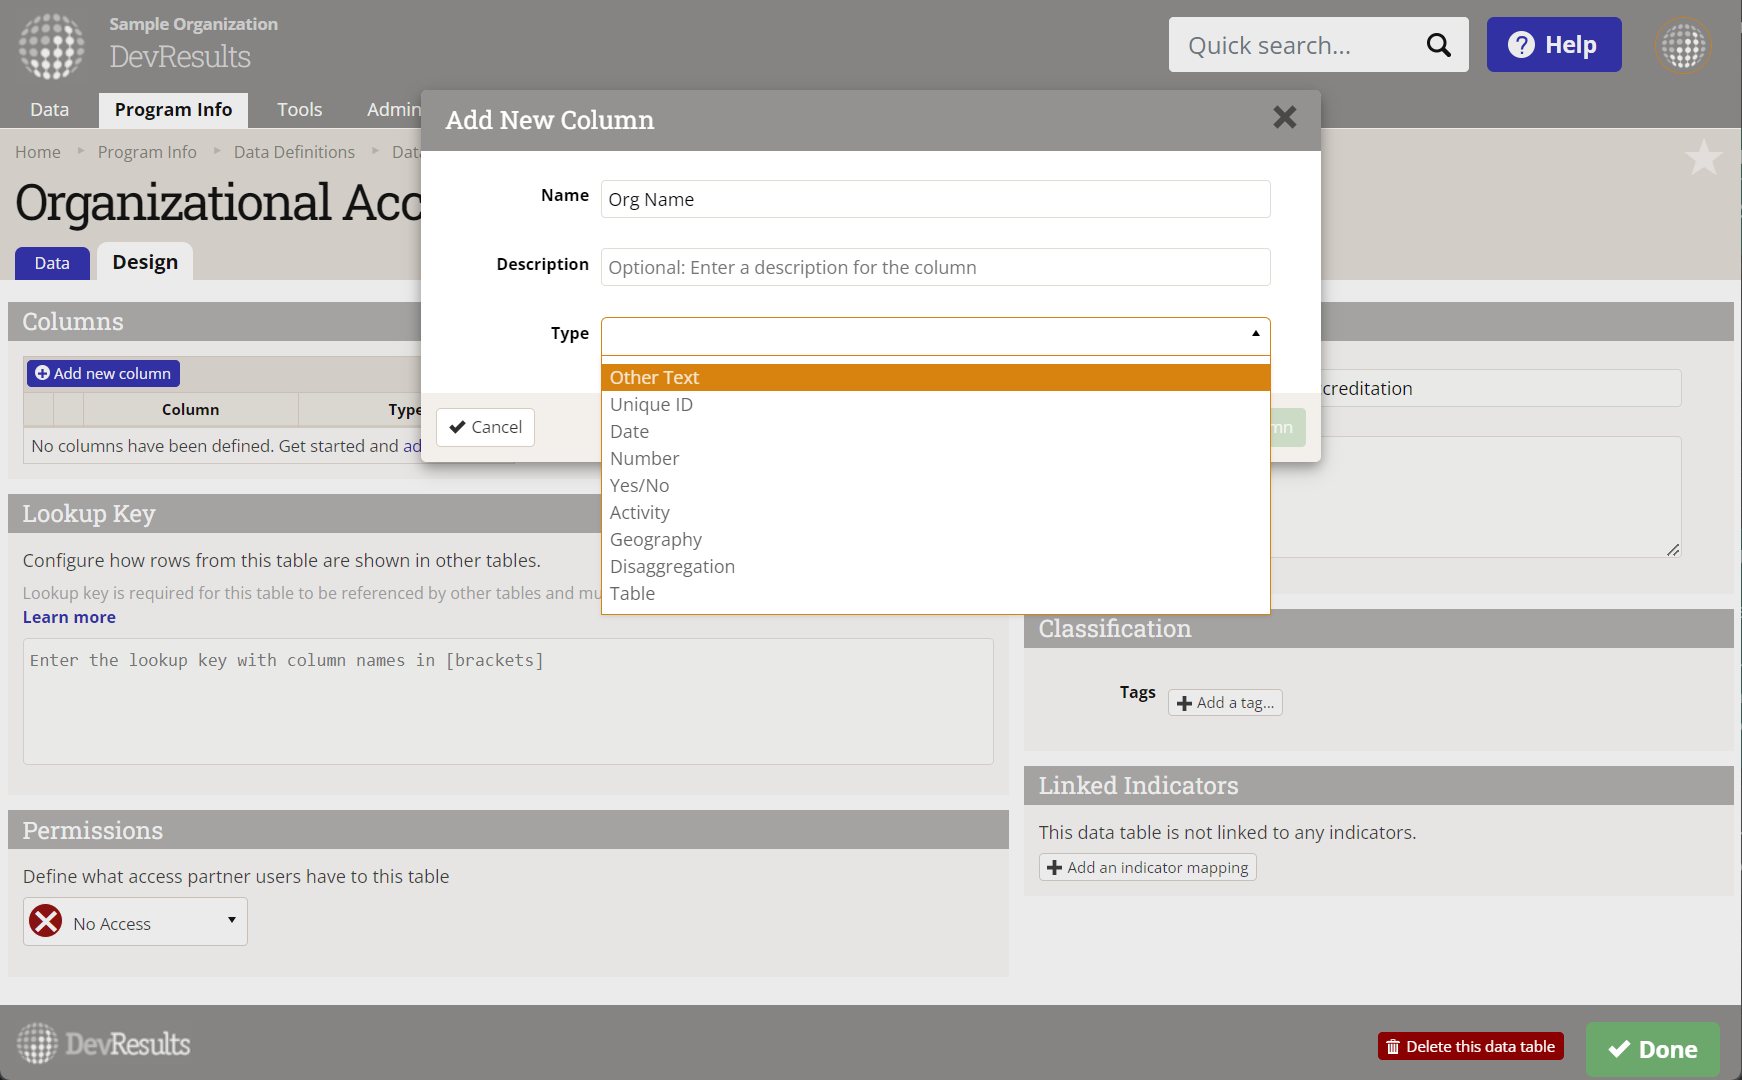
You will be taken to your new data table's Design tab where you can begin adding new columns. The first new column pop-up will be launched automatically. Once you enter the column's Name, optional Description, data Type, and any additional fields that may appear, you can click on the green (+) Add Column button to add it to the list of changes to be saved. To add additional columns, click on the blue (+) Add new column button on the column table.
When you are finished adding columns, click the green (✓) Save changes button. You can always edit column names, descriptions, and formulas (if using calculated columns), but if you want to change a columns data type, you'll have to delete the column, save the change, and then re-add the column with the desired type.
Note: The description text will appear when the user hovers over the column heading on the Data tab, which makes it an ideal location to enter instructions to the person entering data or contextual notes about the data the column contains.
Creating a Data Table by Uploading a Spreadsheet
If you currently store your data in an Excel spreadsheet, or if you're importing data from a third-party system, you can upload this information to DevResults directly.
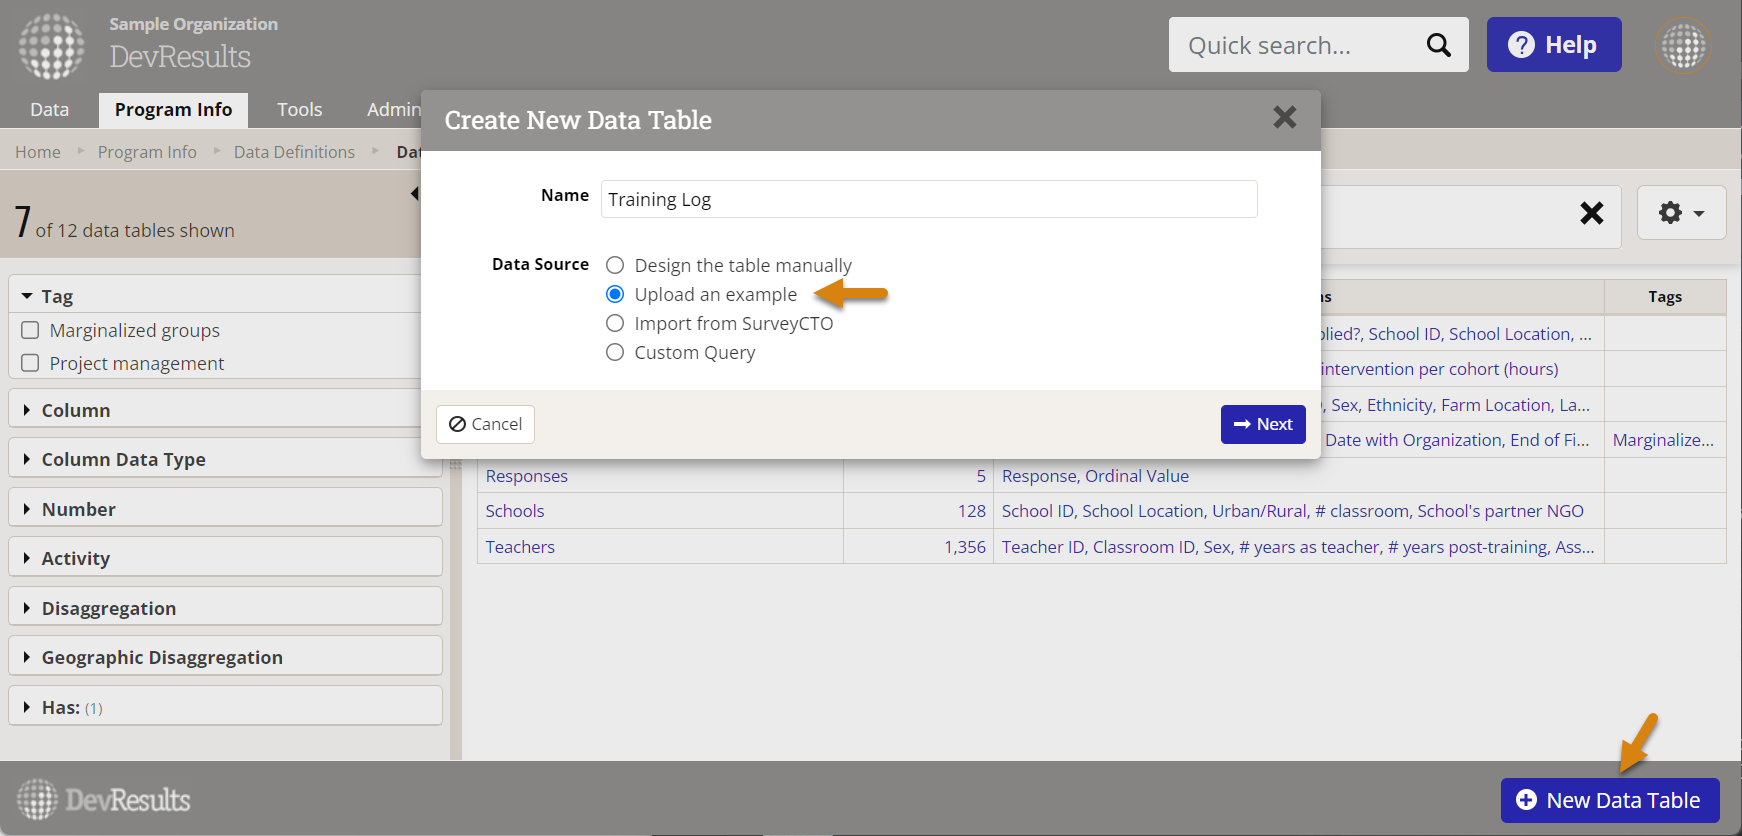
First go to the Data Tables page (Program Info > Data Definitions / Data Tables) and click on the blue (+) New Data Table button. Enter a name for your data table and select Upload an example as your data source. Click Next.
Choose a file from your computer or drag and drop a file into the browser window to load the example. If you are using a multi-sheet Excel file, you will be asked to choose which sheet you want to upload.
You will then be prompted to verify which type of data (Project, Geography, Disaggregation, etc.) is in each of your columns. If the system-suggested type is incorrect, you can change this by clicking on the dropdown or by starting to enter the correct column type into the field you want to change. You can also auto-populate new disaggregation categories into an existing disaggregation by checking the "Auto add new values?" option or create a new disaggregation by typing in a new disaggregation title into the dropdown menu after selecting "Disaggregation."
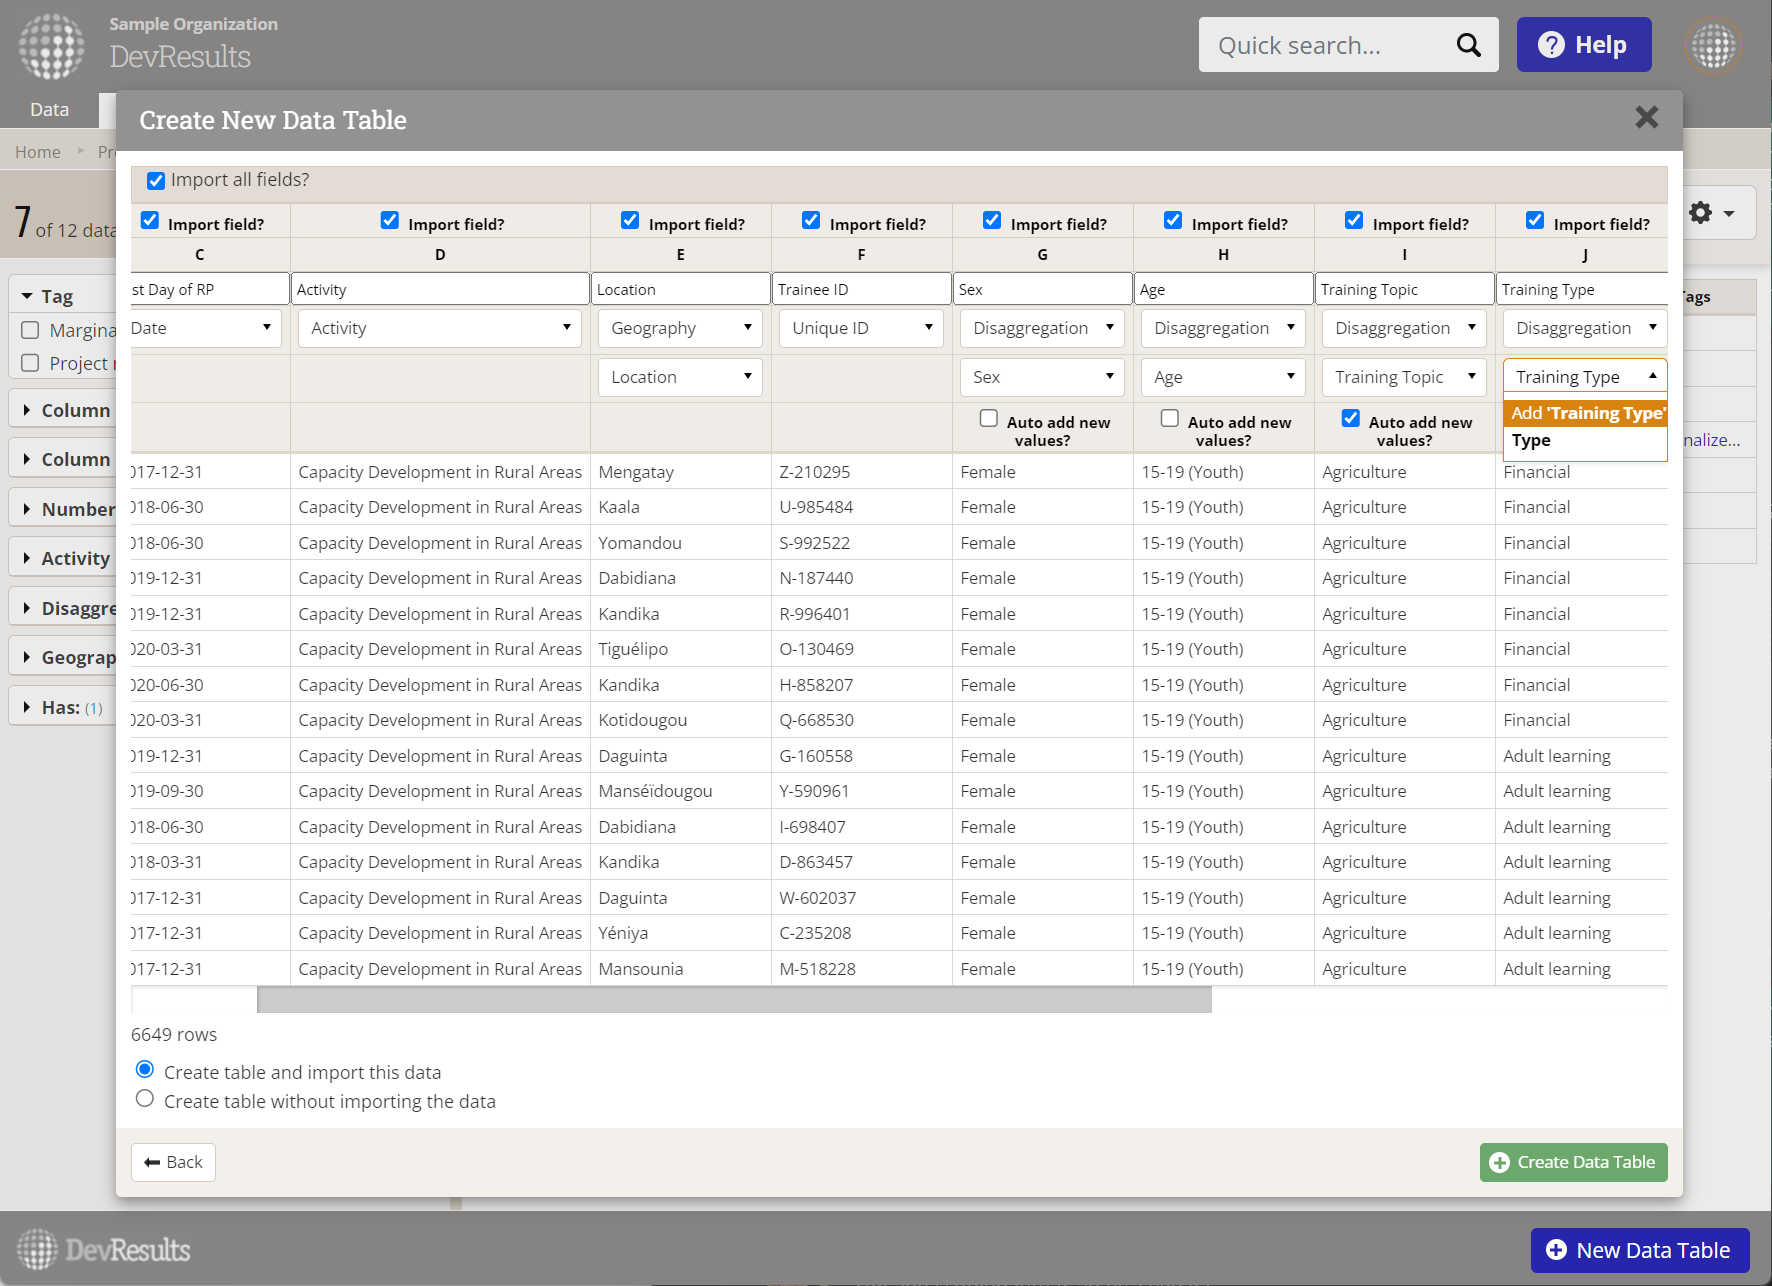
At the bottom of the pop-up window, you can then select whether you want to import the data in your spreadsheet, or if you want to create a data table without importing existing data. Then click the green (+) Create Data Table button to save. Your data table has now been created.
Note: Data tables imported from Excel must have column headings in row 1 that start in column A. Avoid skipping columns, skipping rows, and merging cells. In a multi-spreadsheet workbook, the first spreadsheet cannot be blank.
Creating a data table via an integration
DevResults is directly integrated with both SurveyCTO and KoboToolbox. See the linked help articles to learn how to connect a data table to a survey form on either platform and enable automatic data refreshes.
For all other platforms, the process is the same as creating a data table by uploading a spreadsheet based on an export from the platform of your choice.
Create a table from a custom query
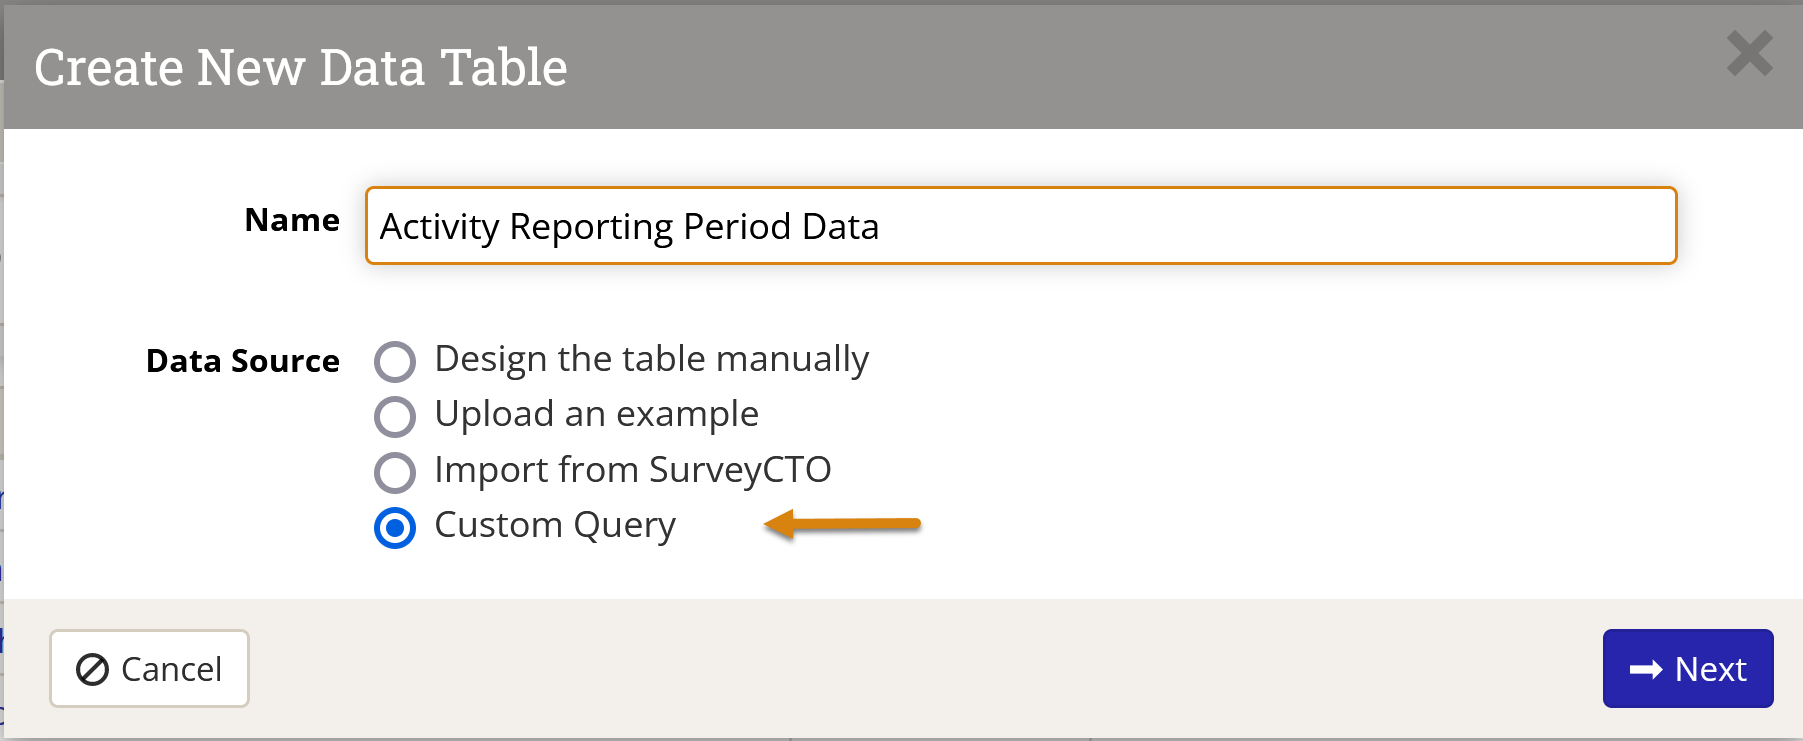
You may be interested in creating indicators that analyze metadata or information that exists elsewhere in your DevResults site. To do so, you can create a data table that pulls information from a new or existing custom query. To create a data table that pulls data from a custom query, navigate to the Data Tables page and click on (+) New data table. Enter a name for your data table and select Custom Query as your data source.
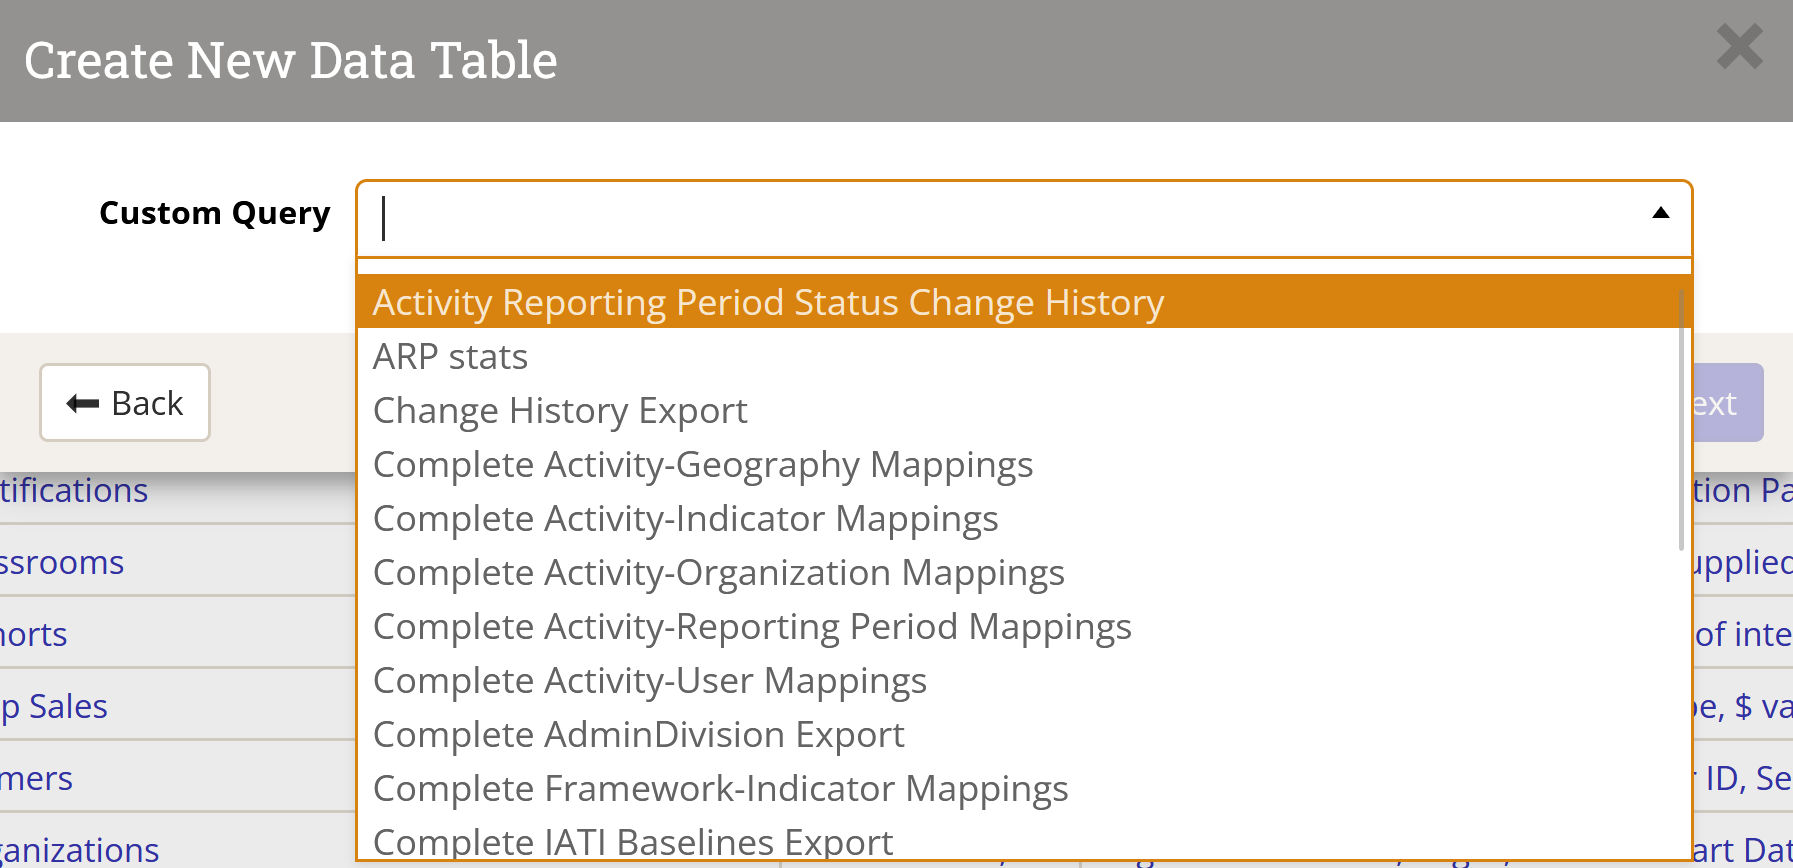
Select a custom query from the dropdown menu.
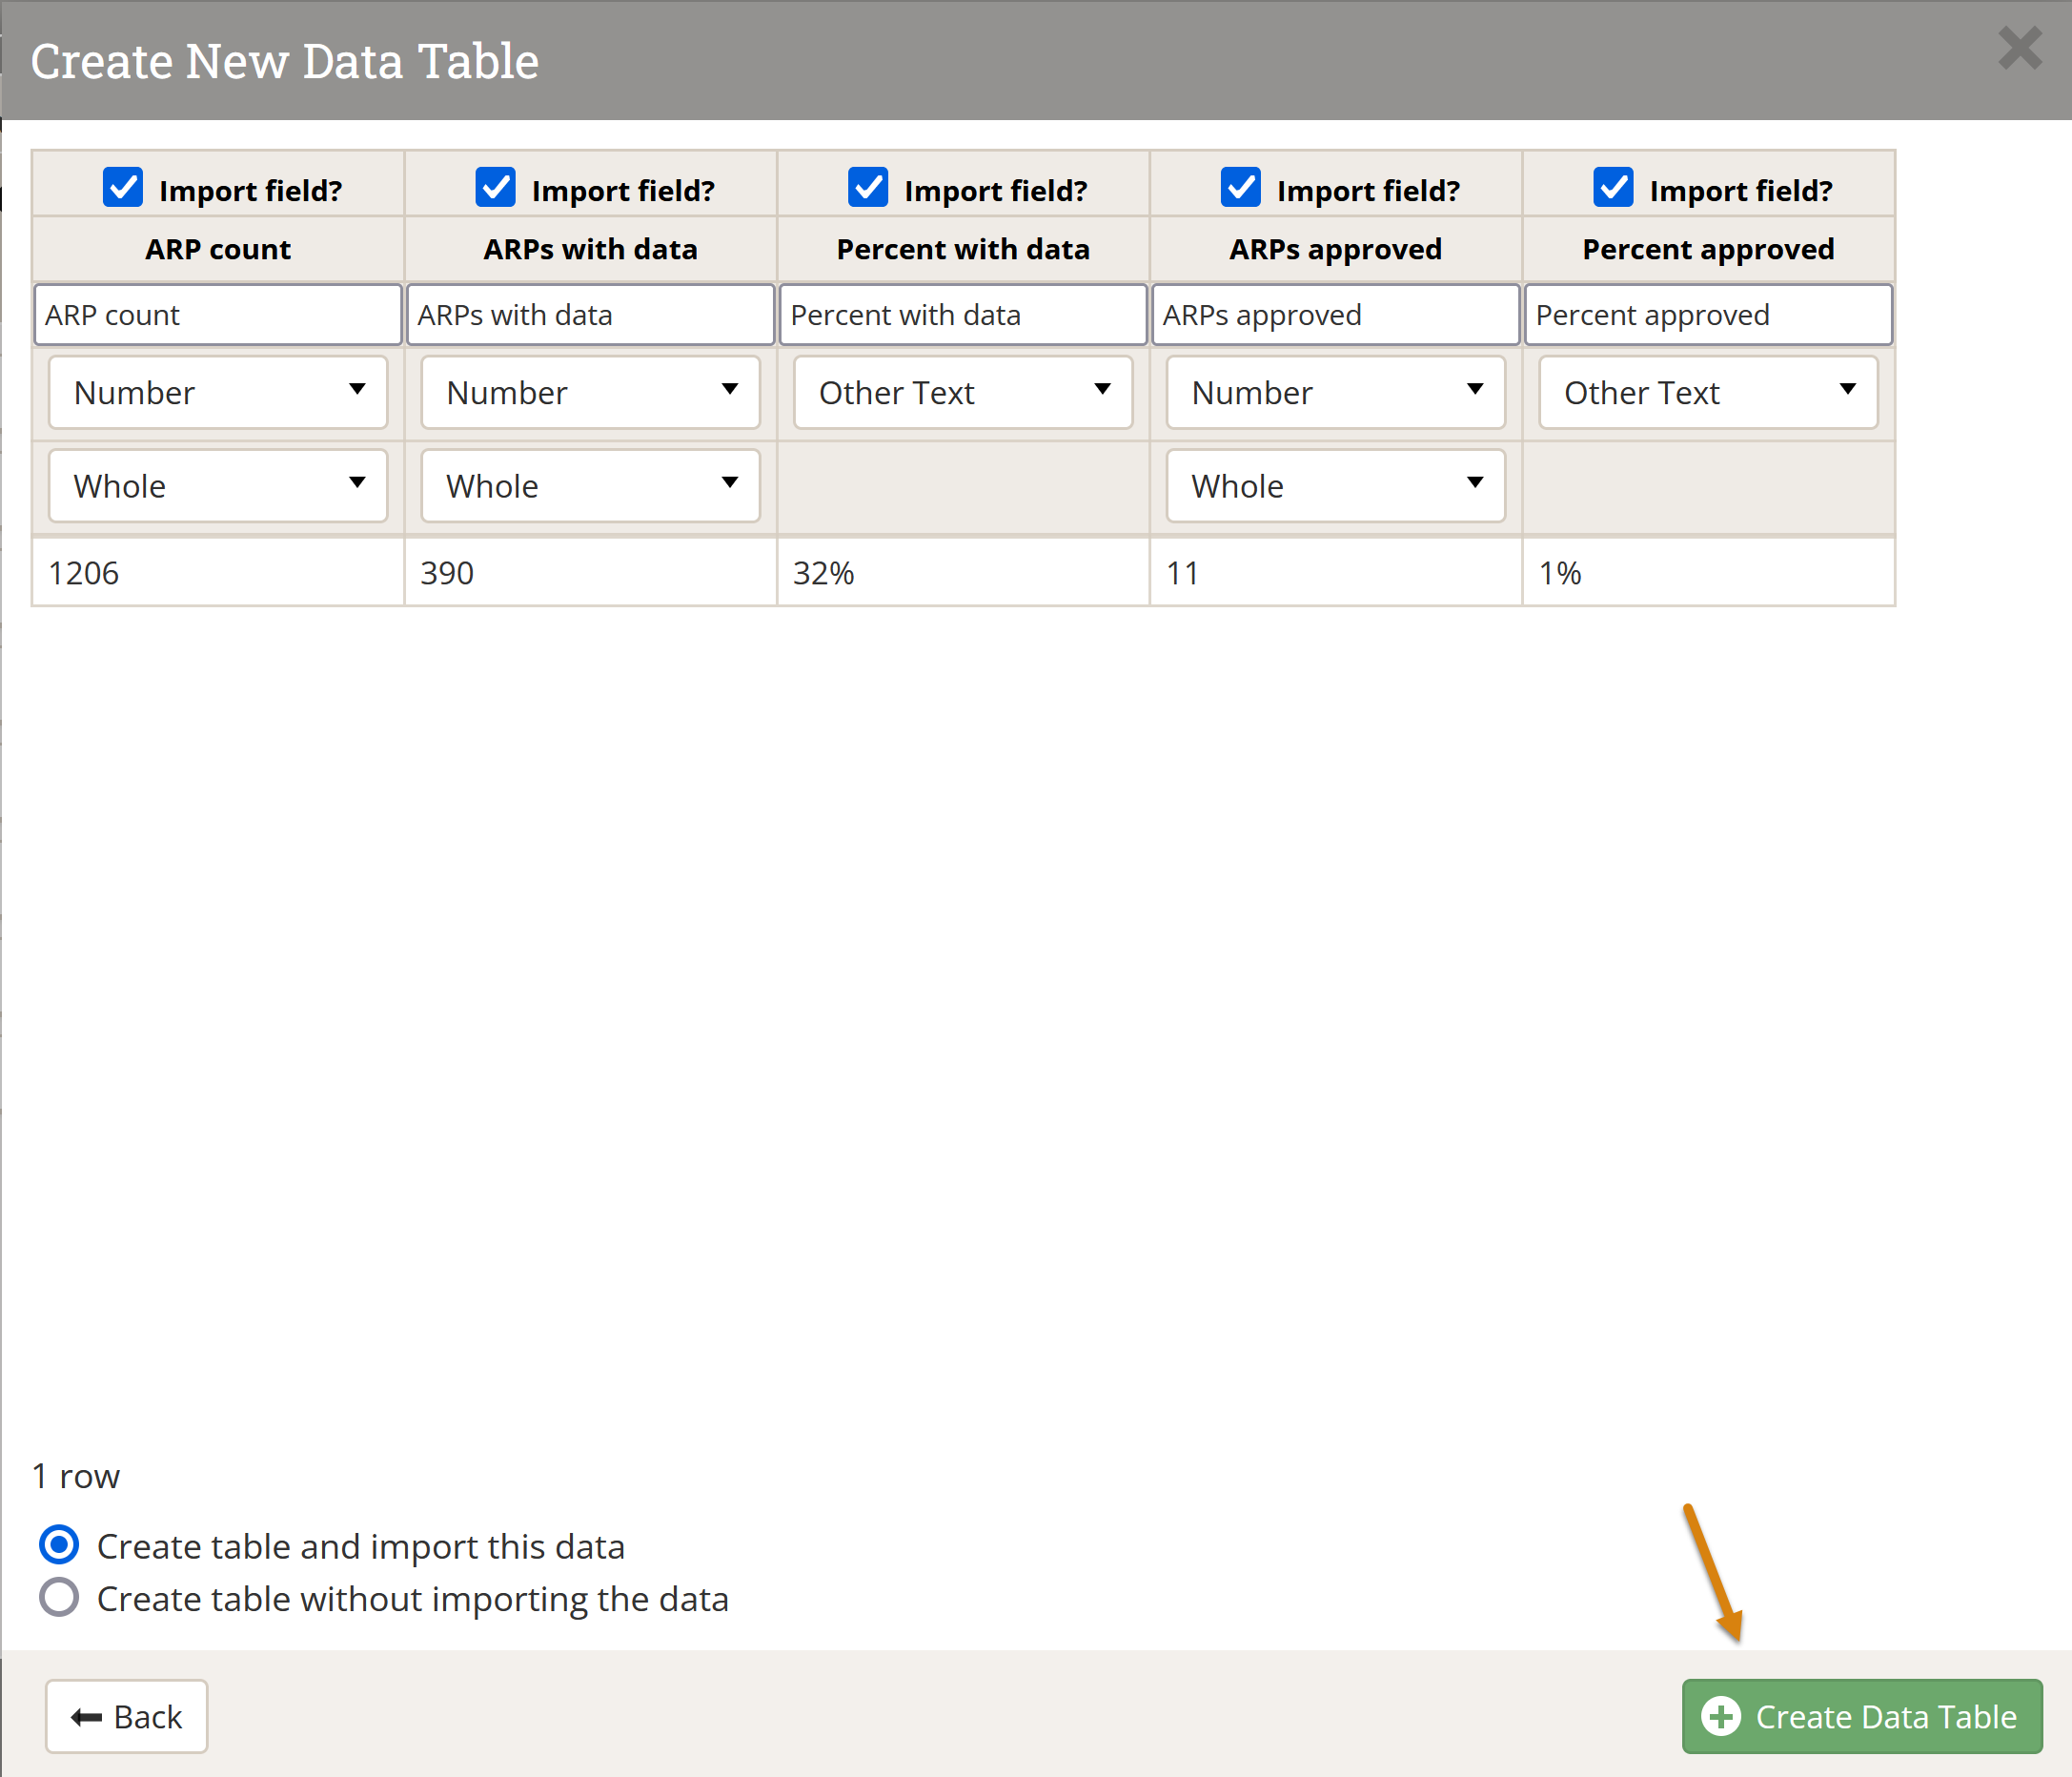
Review the column names and column types to make sure they're correct. If the system-suggested type is incorrect, you can change this by clicking on the dropdown or by starting to enter the correct column type into the field you want to change. You can also auto-populate disaggregation values into an existing disaggregation by checking the "Auto add new values?" button or create a new disaggregation by typing in a new disaggregation title into the dropdown menu after selecting "Disaggregation". Once reviewed, choose whether you want to create the table with or without importing data and click Create Data Table.
If your indicator is populating from a data table, you do not have to add all relevant geographies to your Project Geography tab. The data table indicator will consider all complete records when it calculates the correct result.
Data can be entered and edited either online or via Excel, both by internal users or partners:
- Enter 'Data Table' Data (internal users)
- Report 'Data Table' Data Online (Partners)
- Report 'Data Table' Data via Excel (Partners)
Next, define indicators to populate results directly from data tables.
Calculated columns
In addition to entering data into number and yes/no columns explicitly, you can also use mathematical and conditional logic formulas to calculate values as well, similar to how you might specify a formula that references other columns in Excel.
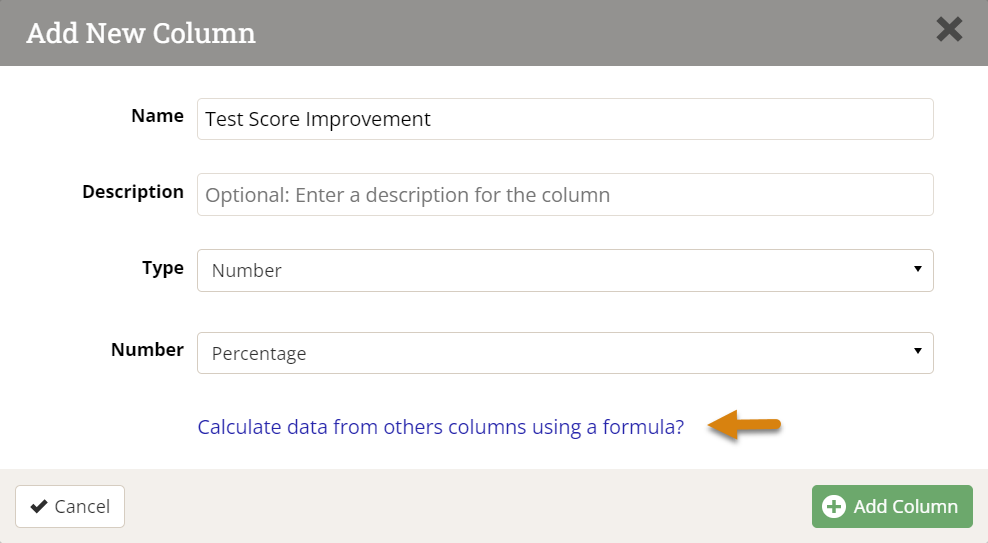
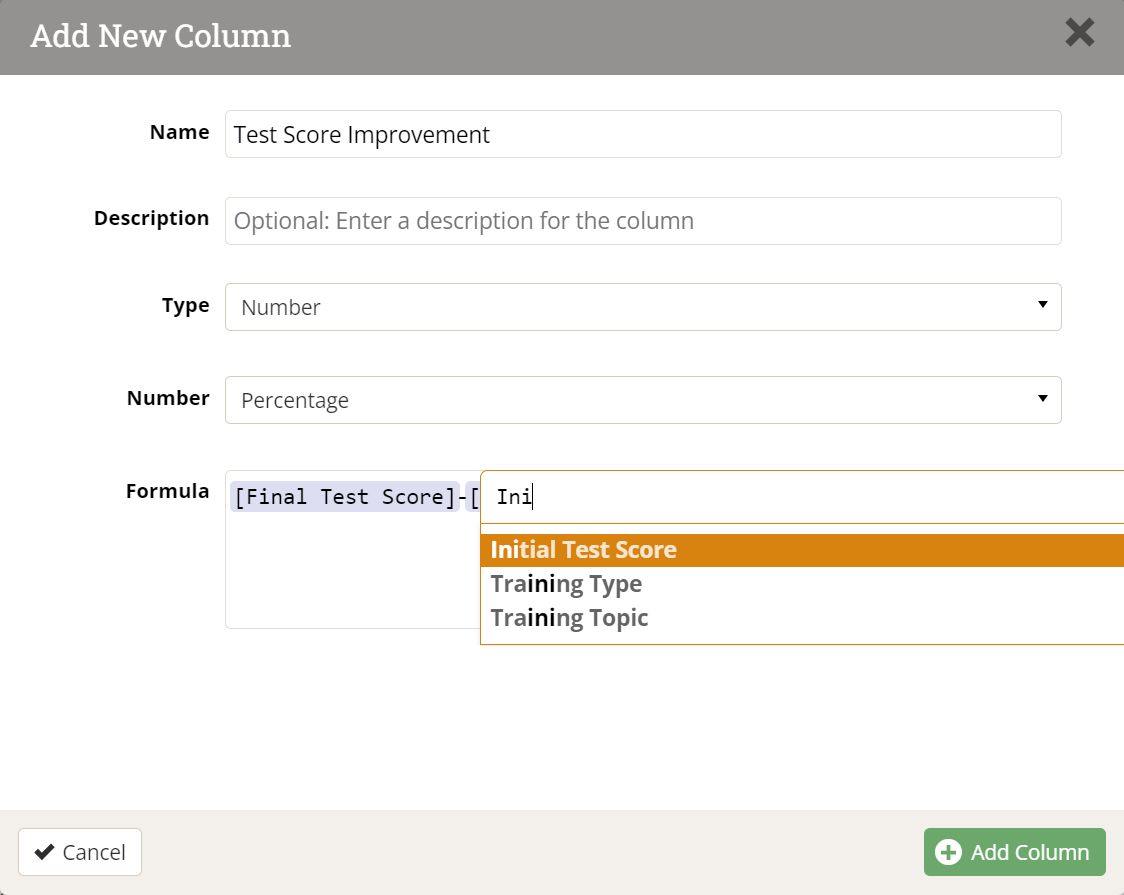
To use a formula to define a column's data, first create a column with either the Number (Whole, Decimal, or Percentage) or Yes/No data type, as appropriate to the desired data format. Then click on the text that asks if you want to "Calculate data from other columns using a formula?"
In the revealed Formula field, type out the formula you wish to use for your calculated column:
- To reference another column, open a square brackets ('[') to choose or filter column names from a dropdown list. Click or hit enter on a column name to automatically close square brackets (`]`) and complete the reference.
- You can use addition (+), subtraction (-), multiplication (*), division (/), or exponentiation (^) in your formula. Other available operations are listed in the table below.
- If the formula has no errors, you can Add Column and (when you're done with other edits) Save Changes to calculate the data for all rows.
Conditional logic
Conditional statements use the IF function. Express conditional statements as:
IF(<expression>, <value_if_true>, <value_if_false>)
Note: For Yes/No columns, the <truepart> and <falsepart> should be set to 1 and 0 (true and false) respectively.
An example Yes/No column to evaluate whether or not the initial test score was a passing grade would look like:
IF([Initial Test Score]>=50, 1, 0)
To create the expression you can use:
| = | Equal to (also ==) |
| != | Not equal to (also <>) |
| > | Greater than |
| >= | Greater than or equal to |
| < | Less than |
| <= | Less than or equal to |
| AND | Boolean "and" (also &&) |
| OR | Boolean "or" (also ||) |
| TRUE | Yes or 1 |
| FALSE | No or 0 |
Other functions
Calculated columns also support the following functions (where [x] is the column name in brackets):
| abs([x]) | Absolute value |
| ceiling([x]) | Smallest whole number greater than or equal to the specified number |
| exp([x]) | e raised to the specified power |
| floor([x]) | Largest whole number less than or equal to the specified number |
| log([x]) | Logarithm of the specified number |
| log10([x]) | Base 10 logarithm of the specified number |
| round([x]) | Value nearest the specified value |
| sqrt([x]) | Square root; equivalent to [x]^(1/2) |
| max([x],[x]) | Returns the maximum value |
| min([x],[x]) | Returns the minimum value |
Didn't answer your question? Please email us at help@devresults.com.