Indicators must be precisely defined so that results can be compared between locations, reporting periods, and projects. We've studied performance data and designed DevResults to enforce indicator definitions that make data useful and meaningful. These definitions include two key principles:
- An indicator's definition is the same for different places, reporting periods, and projects (if applicable). For example, if one project must report disaggregated data for an indicator and another can only report totals, you must make separate indicators.
- Data must be reported incrementally. For example, if you trained 16 people in the third quarter, you report 16 people for that quarter. In DevResults, you would never report the total trained to date or the total so far that year -- only what was done during that reporting period.
In this page:
- Data sources: What are the different ways you can enter data?
- Type: What are the different ways you can aggregate indicator results?
- Format: How do you format numbers in indicator results?
- Unit: How do you define an indicator's unit of measure?
- Disaggregations: How do you categorize or subdivide indicator results?
- Geographic Disaggregation: How do subdivide indicator results geographically?
- Targets: How are targets defined in DevResults?
- Historical data: Can I add historical data to DevResults?
Data sources
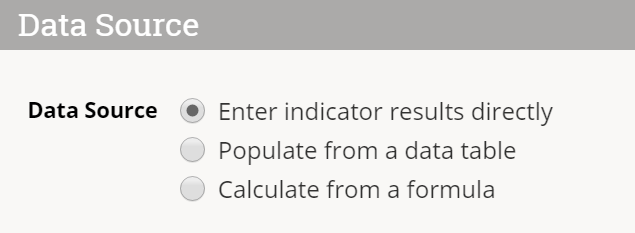
The data source is the method by which an indicator result is added to or created in DevResults. Each indicator has one of three data sources:
- Direct Entry: for entering numbers each reporting period (e.g. once per quarter, per year, etc.)
- Data Table: for entering lists, surveys, logs, and individual-level records (and then the indicator computes the results based on the table)
- Formula: for calculating results from other indicators, like creating a percentage by dividing two indicators or adding two indicators together for an aggregate result
See complete information about data sources.
Type
Every indicator has an indicator type which determins what will happen when indicator results are aggregated. Typically, indicators that are counts will be aggregated via a sum operation (e.g. results from various regions will be added together when displayed at the country level), and indicators that are percentages or ratios will be aggregated via an average or mean operation (e.g. the ratio of trainees passing an exam will be averaged across regions when displayed at the country level).
Yes/No indicators are a special type of average, where the ratio of percentage of 'yes' responses over total responses ('yes' or 'no'), regardless of "(not set)" or null responses, are aggregated to the level necessary for a given query or visualization (e.g. if half of the regions in a country have a 'yes' response, and the other half have a 'no' responses, then the result for that country will be 50%).

Format
Every indicator has one number format. Formats include: whole number, decimal, and percentage. Whole numbers will be rounded to the nearest integer, decimals will include fractional results, and percentages will display results with a '%' symbol (no need to multiply by 100). An indicator cannot be "Number and percent of staff trained". Those would be two different indicators.
There is an interplay where some combinations of indicator type and format are not possible. For instance, an indicator of type "Yes/No" can only be formatted as a percentage. Likewise, percentage formatted results cannot be summed.

If an indicator is a decimal or a percentage, you can specify how many decimal places an indicator result should be rounded to. The system defaults to 2 decimal places.

Unit
Every indicator has either one unit (or no units). For an indicator like "# people trained", the unit would be people or individuals or trainees. Note: number is not a unit.
Examples of other units include facilities, hectares, policies, dollars, jobs, trainings, schools, or metric tons. Percentages and yes/no indicators do not have units.

Disaggregations
Disaggregations are a way to break down indicator definitions into meaningful categories so you can report data for those categories. For example, # lawyers trained could be disaggregated by sex, allowing you to report separate totals of males and females.
Disaggregations are made up of their name and their categories. For example, "Sex" is the name of a disaggregation and "Male" and "Female" are its categories.
An indicator can have any number of disaggregations.
See complete about disaggregations.
Geographic Disaggregation
Geographic disaggregations are handled separately from other kinds of disaggregations for two reasons:
- The categories for a geographic disaggregations are places on maps, so they have to be associated with those geographic details. This enables the maps of indicator results.
- For an indicator disaggregated by province, someone might work in just three of ten provinces. With geographic disaggregations, different projects can be assigned a subset of those provinces.
An indicator might be reported per district or province, or even per "location" -- like individual schools or clinics. If the indicator isn't geographically disaggregated, set the geographic disaggregation to the country name (or to "world" on a multi-country site).
Cumulative vs. incremental targets
Targets can be defined as incremental or cumulative.
- Incremental targets describe the goal only since the last target was entered.
- Cumulative targets describe the goal from the start up until that point.
For example, if you plan to do 50 things each year for four years, you could enter those targets two different ways:
Incremental:
- Year 1: 50
- Year 2: 50
- Year 3: 50
- Year 4: 50
Cumulative:
- Year 1: 50
- Year 2: 100
- Year 3: 150
- Year 4: 200
Both options are equally valid. You can specify how you'd like to enter targets for each indicator.
Historical data
Adding historical data to DevResults is just like adding current data — you enter data in the appropriate historic reporting period, or for a historical date in a data table, just as you would data for the current reporting period/date.
Often you will find that historical data does not conform to the current indicator definition. For instance, while DevResults enforces indicator definitions and geographic disaggregations going forward, Excel spreadsheets without data validation can be inconsistent and lack key details in your historical data record. When this happens, there are five options for how to proceed, all of which involve some tradeoffs:
- Track down the disaggregated data from the original source, e.g. survey results. (This is often difficult to do, but usually the most reliable method.)
- Estimate the disaggregations for previous data. (It's best to note this somewhere, as inaccurate estimates can be misleading or biased.)
- Define previous data and future data with separate indicators. (This can make it more difficult to examine changes over time.)
- Note: You can add such indicators together in a formula indicator to get an overview of totals and shared disaggregations over time.
- Re-define the current indicator definition to fit previous data. (Going forward, the data will be less specific and therefore less useful.)
- Do not include any data that does not fit the indicator definition. (This represents a loss of previous information and record of work done.)
We can help with any of these options once you've decided what will work best for your organization.
Didn't answer your question? Please email us at help@devresults.com.