- What are disaggregations and what information do I need to define them?
- Create a disaggregation
- Edit a disaggregation
- Upload new disaggregations
- Assign disaggregations to indicators
- What are "cross-disaggregation" and "parallel disaggregation"?
- How many disaggregations can I assign to an indicator?
- Parallel disaggregation: What is a primary disaggregation?
- Where is the primary disaggregation used?
- What happens when I disable a disaggregation for an indicator that's already reported data?
What are disaggregations and what information do I need to define them?
Disaggregations are a way to break down indicator definitions into meaningful categories so you can report data for those categories. For example, # lawyers trained could be disaggregated by sex, allowing you to report separate totals of males and females.
To create or edit a disaggregation, you will need to know:
- The name of the disaggregation. This is how it will appear in indicator definitions, data tables, visualizations, and MultiMatrix reports. Common disaggregation names include Age, Sex, Gender, Ethnicity, Training Type, Organization Type, etc.
- The categories for the disaggregation. For an age disaggregation, the categories might be "under 18", "18-65", and "over 65".
This page only covers non-geographic disaggregations. Geographic disaggregations like country, region, district, town, facility, etc., are handled separately and should not be added to your disaggregations list. To find out more about geographic disaggregations, please see Geographies.
Create a disaggregation
To create a disaggregation, go to Program Info > Disaggregations.
Click the + New Disaggregation button and enter the name of the disaggregation (e.g. Sex). Click + Create Disaggregation.
Then, add each Category to the Disaggregation Categories table. Each category (e.g. Female) should be listed in a separate row.
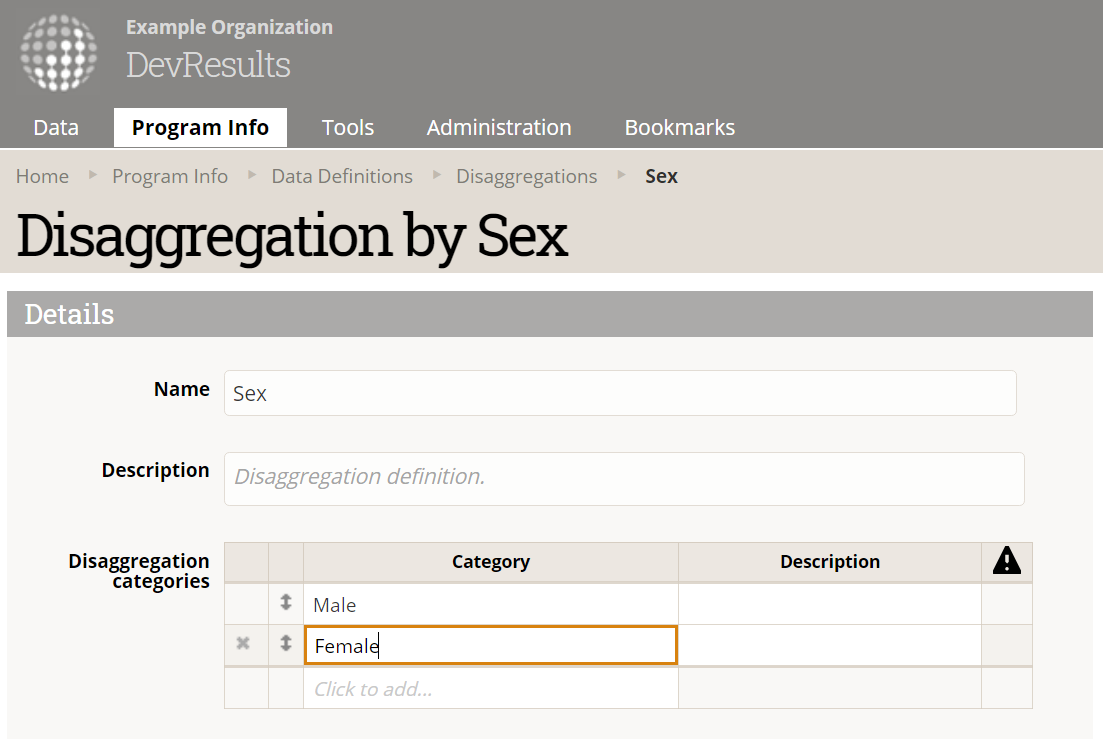
It is optional to add descriptions for disaggregations and their categories.
Edit a disaggregation
To edit a disaggregation, go to Program Info > Disaggregations. Click on the disaggregation you'd like to edit. Click on the text of the Name, Description, or Disaggregation Categories to change the spelling or phrasing.
Editing the text for Name, Description, or Disaggregation Categories does not affect any associated data, it only changes the labels. For that reason, it's probably OK to rename a disaggregation like "Org tax status" to "Org Type," or a category like "501(c)3" to "Nonprofit." However, changing a disaggregation like "Sex" to "Age" would not be appropriate, and any existing data would then be mislabeled.
Adding or reordering disaggregation categories does not affect associated data.
Deleting disaggregation categories will delete:
- Indicator data reported for this disaggregation category
- Data reported to data tables for this disaggregation category
- Formula indicators whose formulas reference a deleted disaggregation category will fail to calculate
Deleting the disaggregation itself will delete all associated data, including:
- This disaggregation from indicator definitions
- Indicator data reported for this disaggregation
- Data table columns, and their data, referencing this disaggregation
- Indicator-data table calculations or filters referencing this disaggregation
- Formula indicators whose formulas reference a deleted disaggregation will fail to calculate
To investigate consequences of deleting a disaggregation or disaggregation category, please use your training site.
Upload new disaggregations
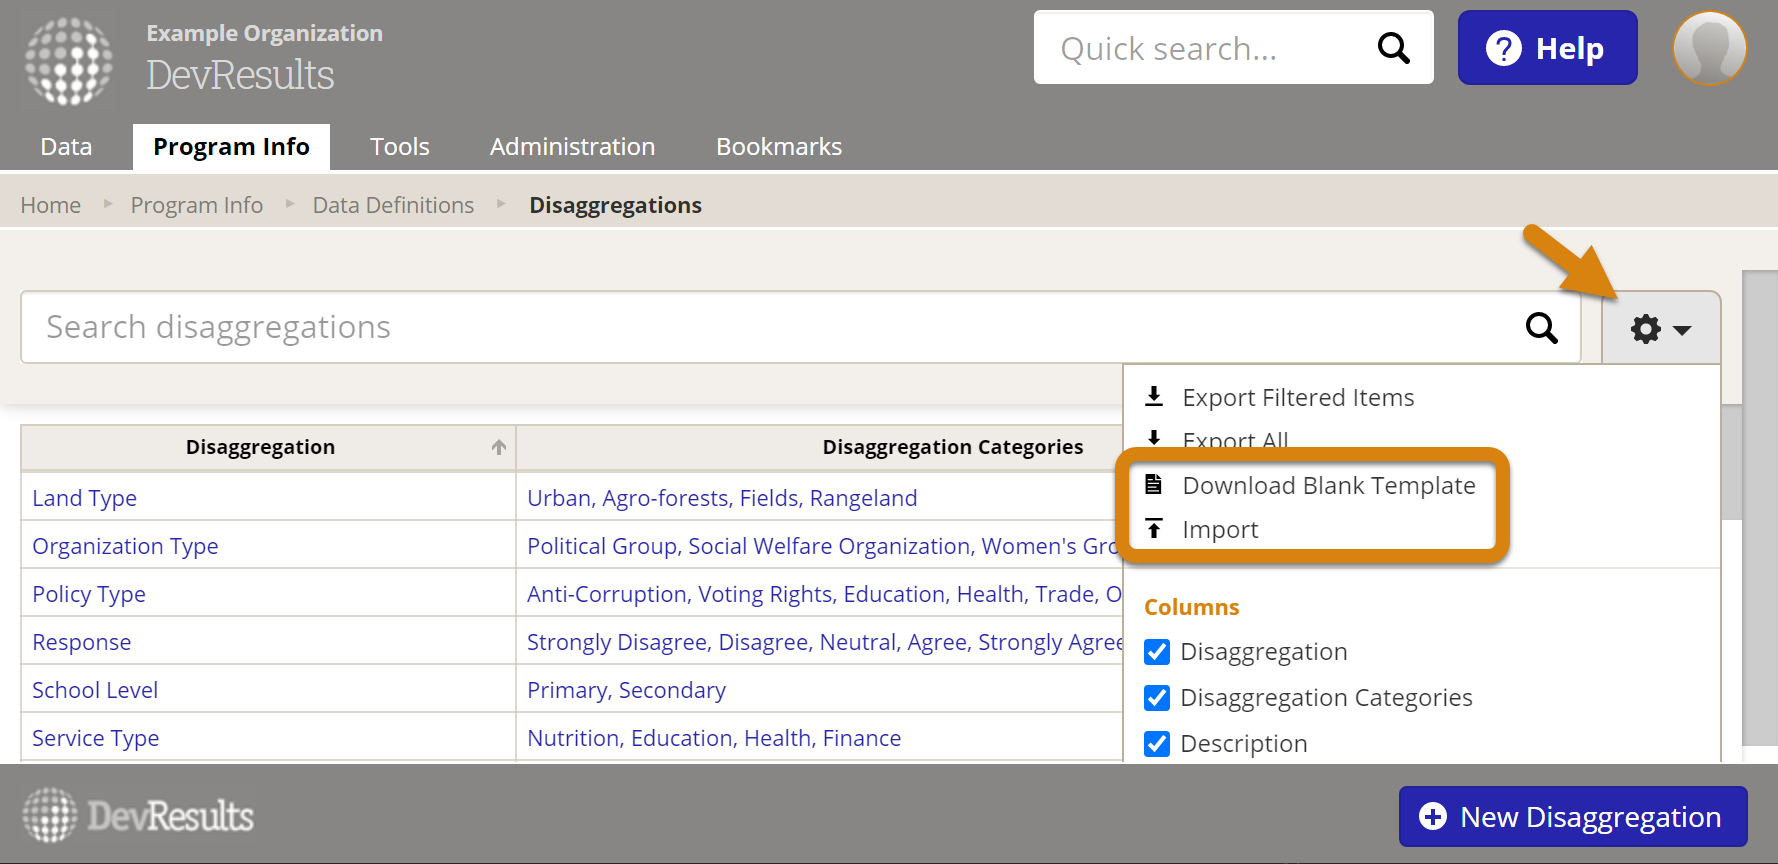
To upload new disaggregations, go to Program Info > Disaggregations, click on the gear icon, and choose Download Blank Template. Add unlimited disaggregations to the Excel template and then choose Import from the same menu.
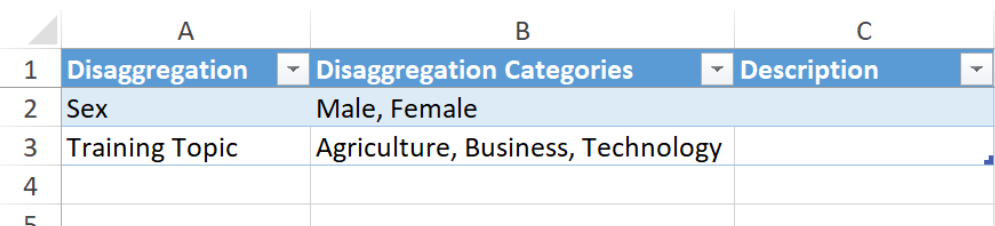
When you list disaggregations in your template, each row should define one disaggregation. The disaggregations categories should be all in the same cell to the right of the disaggregation, separated by commas. The description field is optional.
Disaggregations cannot be edited using an Excel file so if you need to change any existing disaggregations, edit them online as usual.
New disaggregations are created automatically if you upload new indicators with new disaggregations, but the disaggregation categories must then be completed online.
Assign disaggregations to indicators
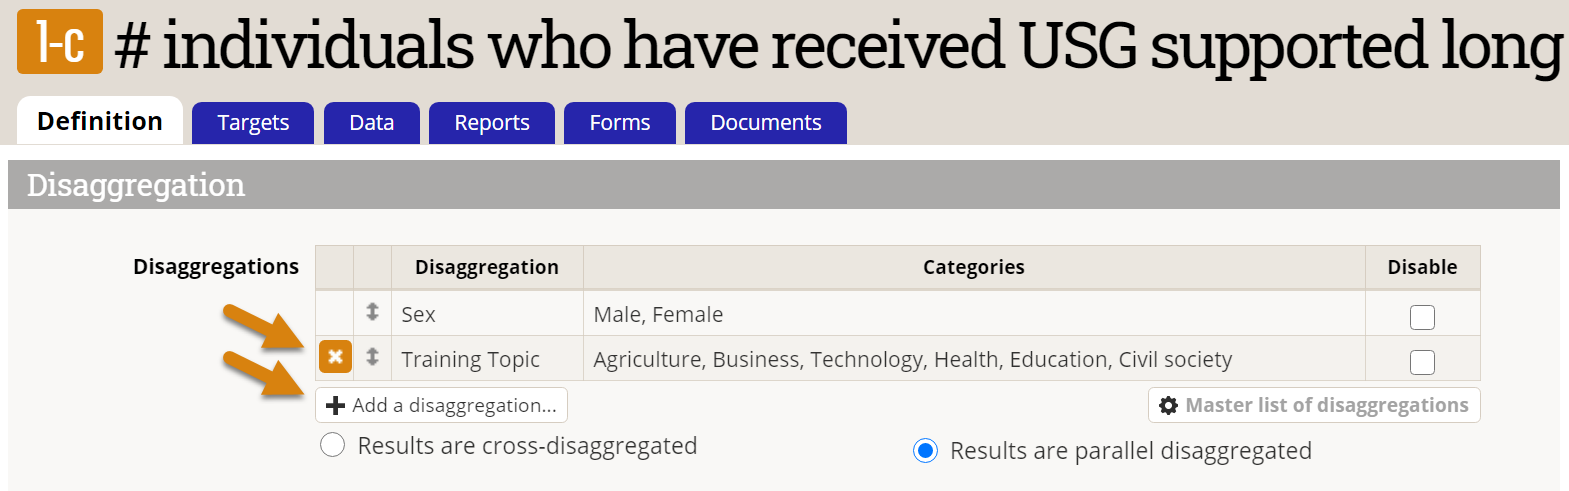
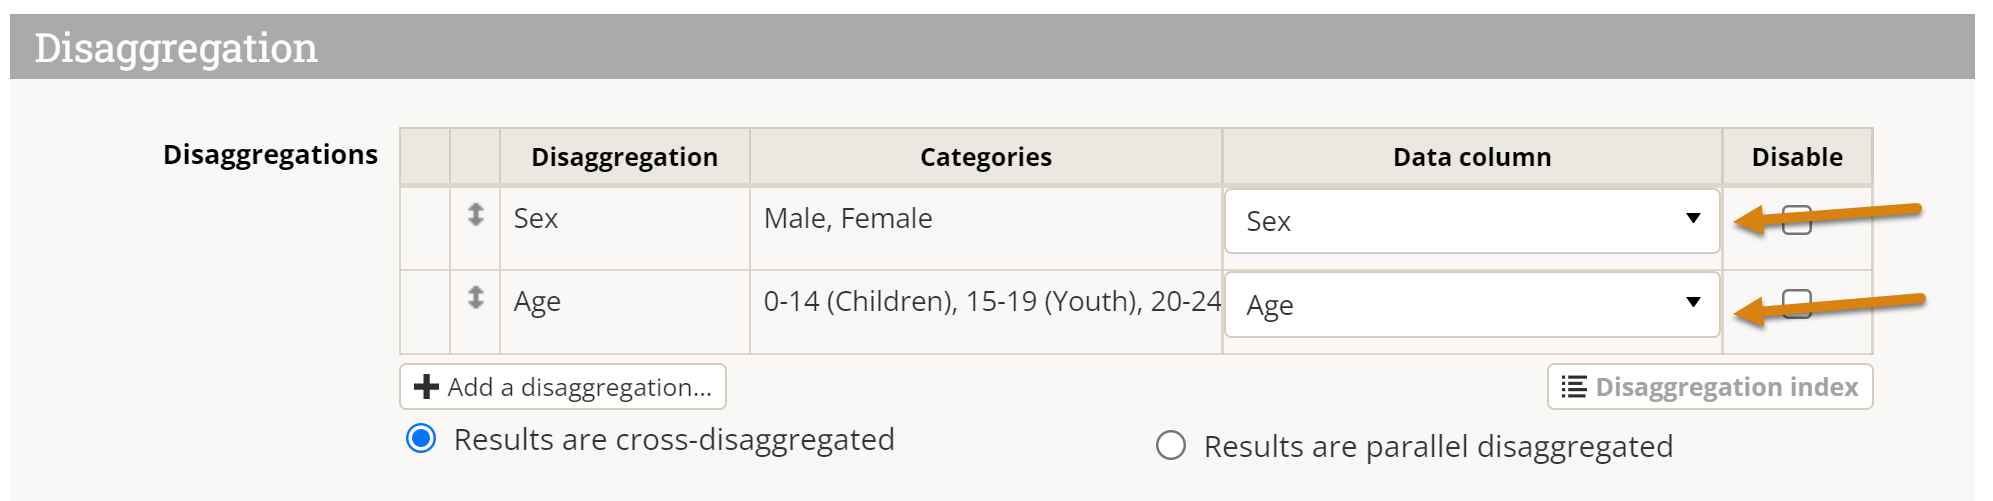
Assign, unassign, or reorder and indicator's disaggregations in the Disaggregation section of an indicator's Definition tab (Program Info > Indicators > select indicator).
The process is the same when adding disaggregations to an indicator that is pulled from a data table with one more step. For reach disaggregation that is selected, the data column should be completed as well. The drop down menu will show all the data columns table, and the column that contains the added disaggregation should be selected.
When reordering disaggregations, be aware of the consequences of changing the primary disaggregation for a parallel-disaggregated indicator.
What are "cross-disaggregation" and "parallel disaggregation"?
When you assign more than one disaggregation to an indicator, you must define the indicator as cross-disaggregated or parallel-disaggregated. This tells the system whether it should combine the disaggregation categories in data entry and display (cross), or whether it should treat them as completely independent and separate categories (parallel):
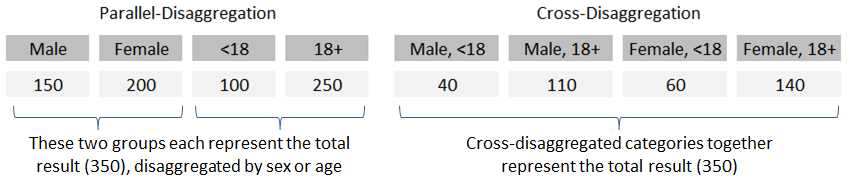
- For parallel-disaggregation, the total result is reported for each disaggregation, split by its disaggregation categories. The example below shows a result reported for males, females, minors, and adults.
- For cross-disaggregated data, the disaggregation categories are combined to make unique definitions. The example shows a result reported for male minors, male adults, female minors, and female adults.
How many disaggregations can I assign to an indicator?
DevResults will support many disaggregations provided that the number of combined disaggregation categories — or columns representing all possible data entry fields — do not exceed:
- 300 columns on an online direct entry page (or it will not display)
- 1000 columns in a downloaded Excel direct entry template (or it will not download)
- 2048 columns for a calculated formula indicator (or it will not calculate)
For parallel-disaggregated data, disaggregation categories are additive, so the sum of each disaggregation's number of categories determines the number of columns in a data entry grid (where rows are determined by the number of geographic disaggregations). For cross-disaggregated data, disaggregation categories are multiplicative. To illustrate, if a direct entry indicator were parallel-disaggregated by sex (male and female — 2 categories) and work status (employed, unemployed, retired — 3 categories), there would be only 5 columns (2 + 3 = 5); if that same indicator were instead cross-disaggregated, it would be 6 columns (2 x 3 = 6).
The difference in this example in the number of columns and cells that must be inputted is negligible, but adding many disaggregations with many categories each can quickly multiply that difference beyond 300 (adding just one more four-category disaggregation would quadruple the number to 24). With a data entry table that large, the page itself becomes unwieldy to scroll and entering data accurately is impractical. For this reason, we limit the number of disaggregation categories to 300 as a practical matter, although users may have difficulty before that limit.
Generally speaking, while it is considered good practice to have rich data that is sufficiently disaggregated to address important questions, it is not good practice to collect excessively detailed data without a clear analysis plan to use such data. The burden placed on data collectors exceeds the value gained, and the intrusion and risk associated with amassing sensitive data on vulnerable populations becomes untenable.
Parallel disaggregation: What is a primary disaggregation?
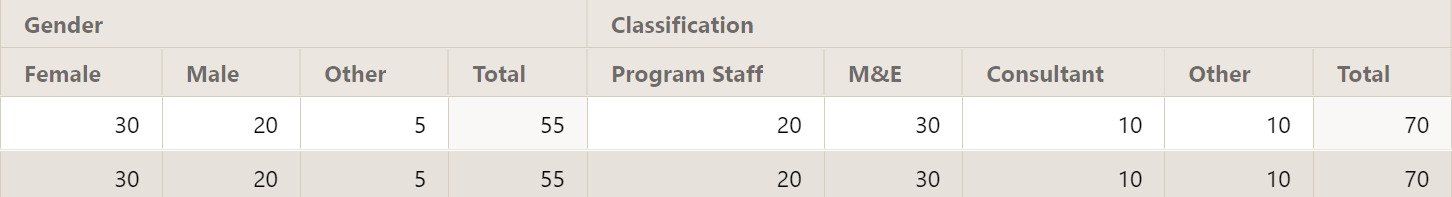
When an indicator with more than one disaggregation is parallel-disaggregated rather than cross-disaggregated, DevResults must establish the "default" disaggregation for providing summary data for the indicator. Adding data together for separate disaggregations would cause double-counting, so DevResults uses the first listed disaggregation as the primary disaggregation. In this example, Gender is the primary disaggregation so the total for the indicator is always Female + Male + Other. This total might or might not be equal to the total of Program Staff + M&E + Consultant + Other, because someone might be both Program Staff and M&E staff, like in this example:
Best practices:
- Categories for the primary disaggregation must be mutually exclusive (nothing is counted in more than one category). Categories for non-primary disaggregations don't have to be mutually exclusive. (e.g. Someone might be Program Staff and M&E Staff.)
- If one parallel disaggregation is always reported and the other is only sometimes reported, use the one that is always reported as the primary disaggregation (if its categories are mutually exclusive).
To change your primary disaggregation, you can drag your preferred disaggregation to the top of the list.
Note: Changing the primary disaggregation for direct-entry indicators will delete all numerical indicator results for that indicator, for all reporting periods and all projects. Indicator comments are unaffected.
Where is the primary disaggregation used?
For parallel-disaggregated indicators, you will only see the primary disaggregation totals in these situations:
- MultiMatrix reports with default settings (when no disaggregations are explicitly selected)
- The indicator's Reports tab visualizations (when no disaggregations are explicitly selected)
- The indicator's Actuals vs. Targets graph
In these contexts, you will only see indicator results displayed when data has been entered for the primary disaggregation.
In MultiMatrix and the indicator's Reports tab, you can see results for a non-primary disaggregation if you select that disaggregation in the configuration panel on the left.
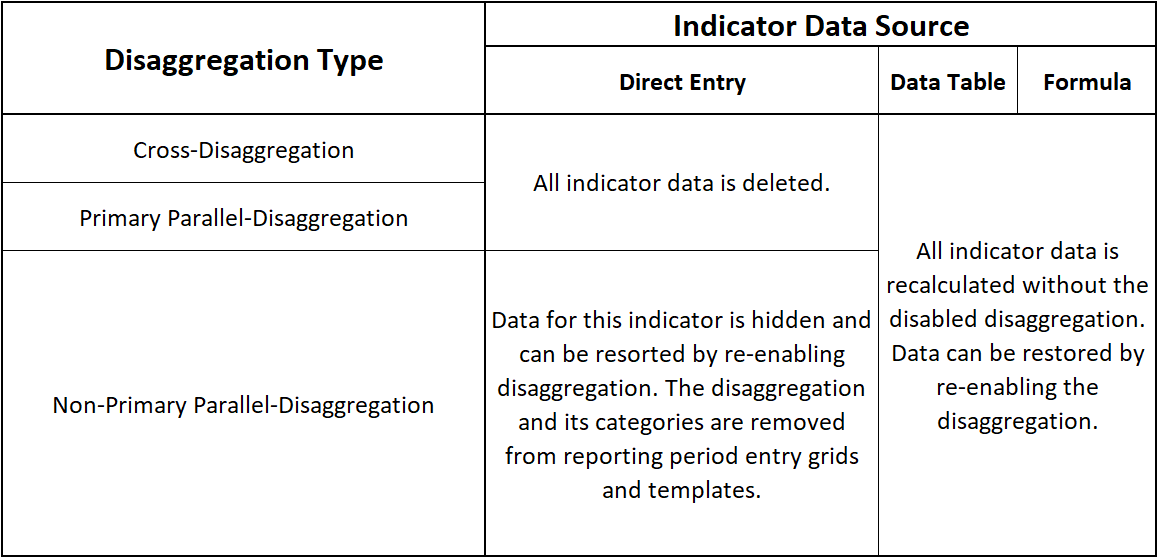
What happens when I disable a disaggregation for an indicator that's already reported data?
This depends on the indicator's data source and whether the indicator is cross- or parallel-disaggregated. Here's a breakdown of what to expect:
Didn't answer your question? Please email us at help@devresults.com.