Matrix is a powerful query tool for creating reports. Find Matrix in any indicator's reports tab.
The display section lets you choose how to slice, dice, and analyze your data. The filter section lets you choose a subset of your data to include. You'll also find the updated display and filter options on other visualization tools, including dashboard tiles for indicator results.
Here's a quick feature guide to get you started:
- Cross-disaggregated reports (new)
- Group reporting periods by fiscal year (new)
- Unlimited display disaggregations (new)
- Include actuals and targets (improved)
- Calculate percent of project targets and global targets (new)
- View information incrementally or cumulatively (now including target analyses)
- Show or hide totals for each grouping/disaggregation (new)
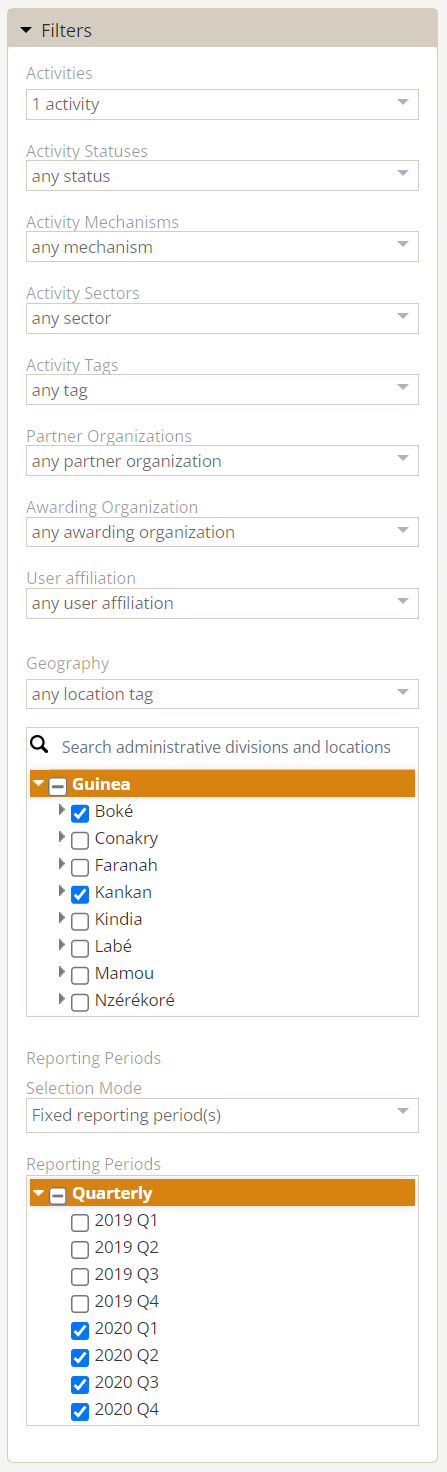
- Expanded/improved filters for projects, organizations, disaggregations, geographies, and reporting periods.

The filters use "OR" logic within a single filter plus "AND" logic between filters. For example, if you choose two projects from the project filter and two quarters from the reporting periods filter, you'll see data for for both projects, but only for the selected quarters.
The User Affiliation filter narrows results to only the projects that the report viewer is affiliated with. For example, if you filtered a report to "User has bookmarked project" and then shared it with another user, it would show results for the projects that were bookmarked by the new report viewer, not the report creator.

Permissions required to use Matrix: view or view/edit for project overview, indicator results, indicator targets, organizations, geography, and reporting periods.
Didn't answer your question? Please email us at help@devresults.com.