DevResults allows users to visualize metadata for your project portfolio. These tools let you create matrix reports and pie charts for counts of your projects by geography, status, mechanism, framework, sector, tag, user, organization, and other project metadata.
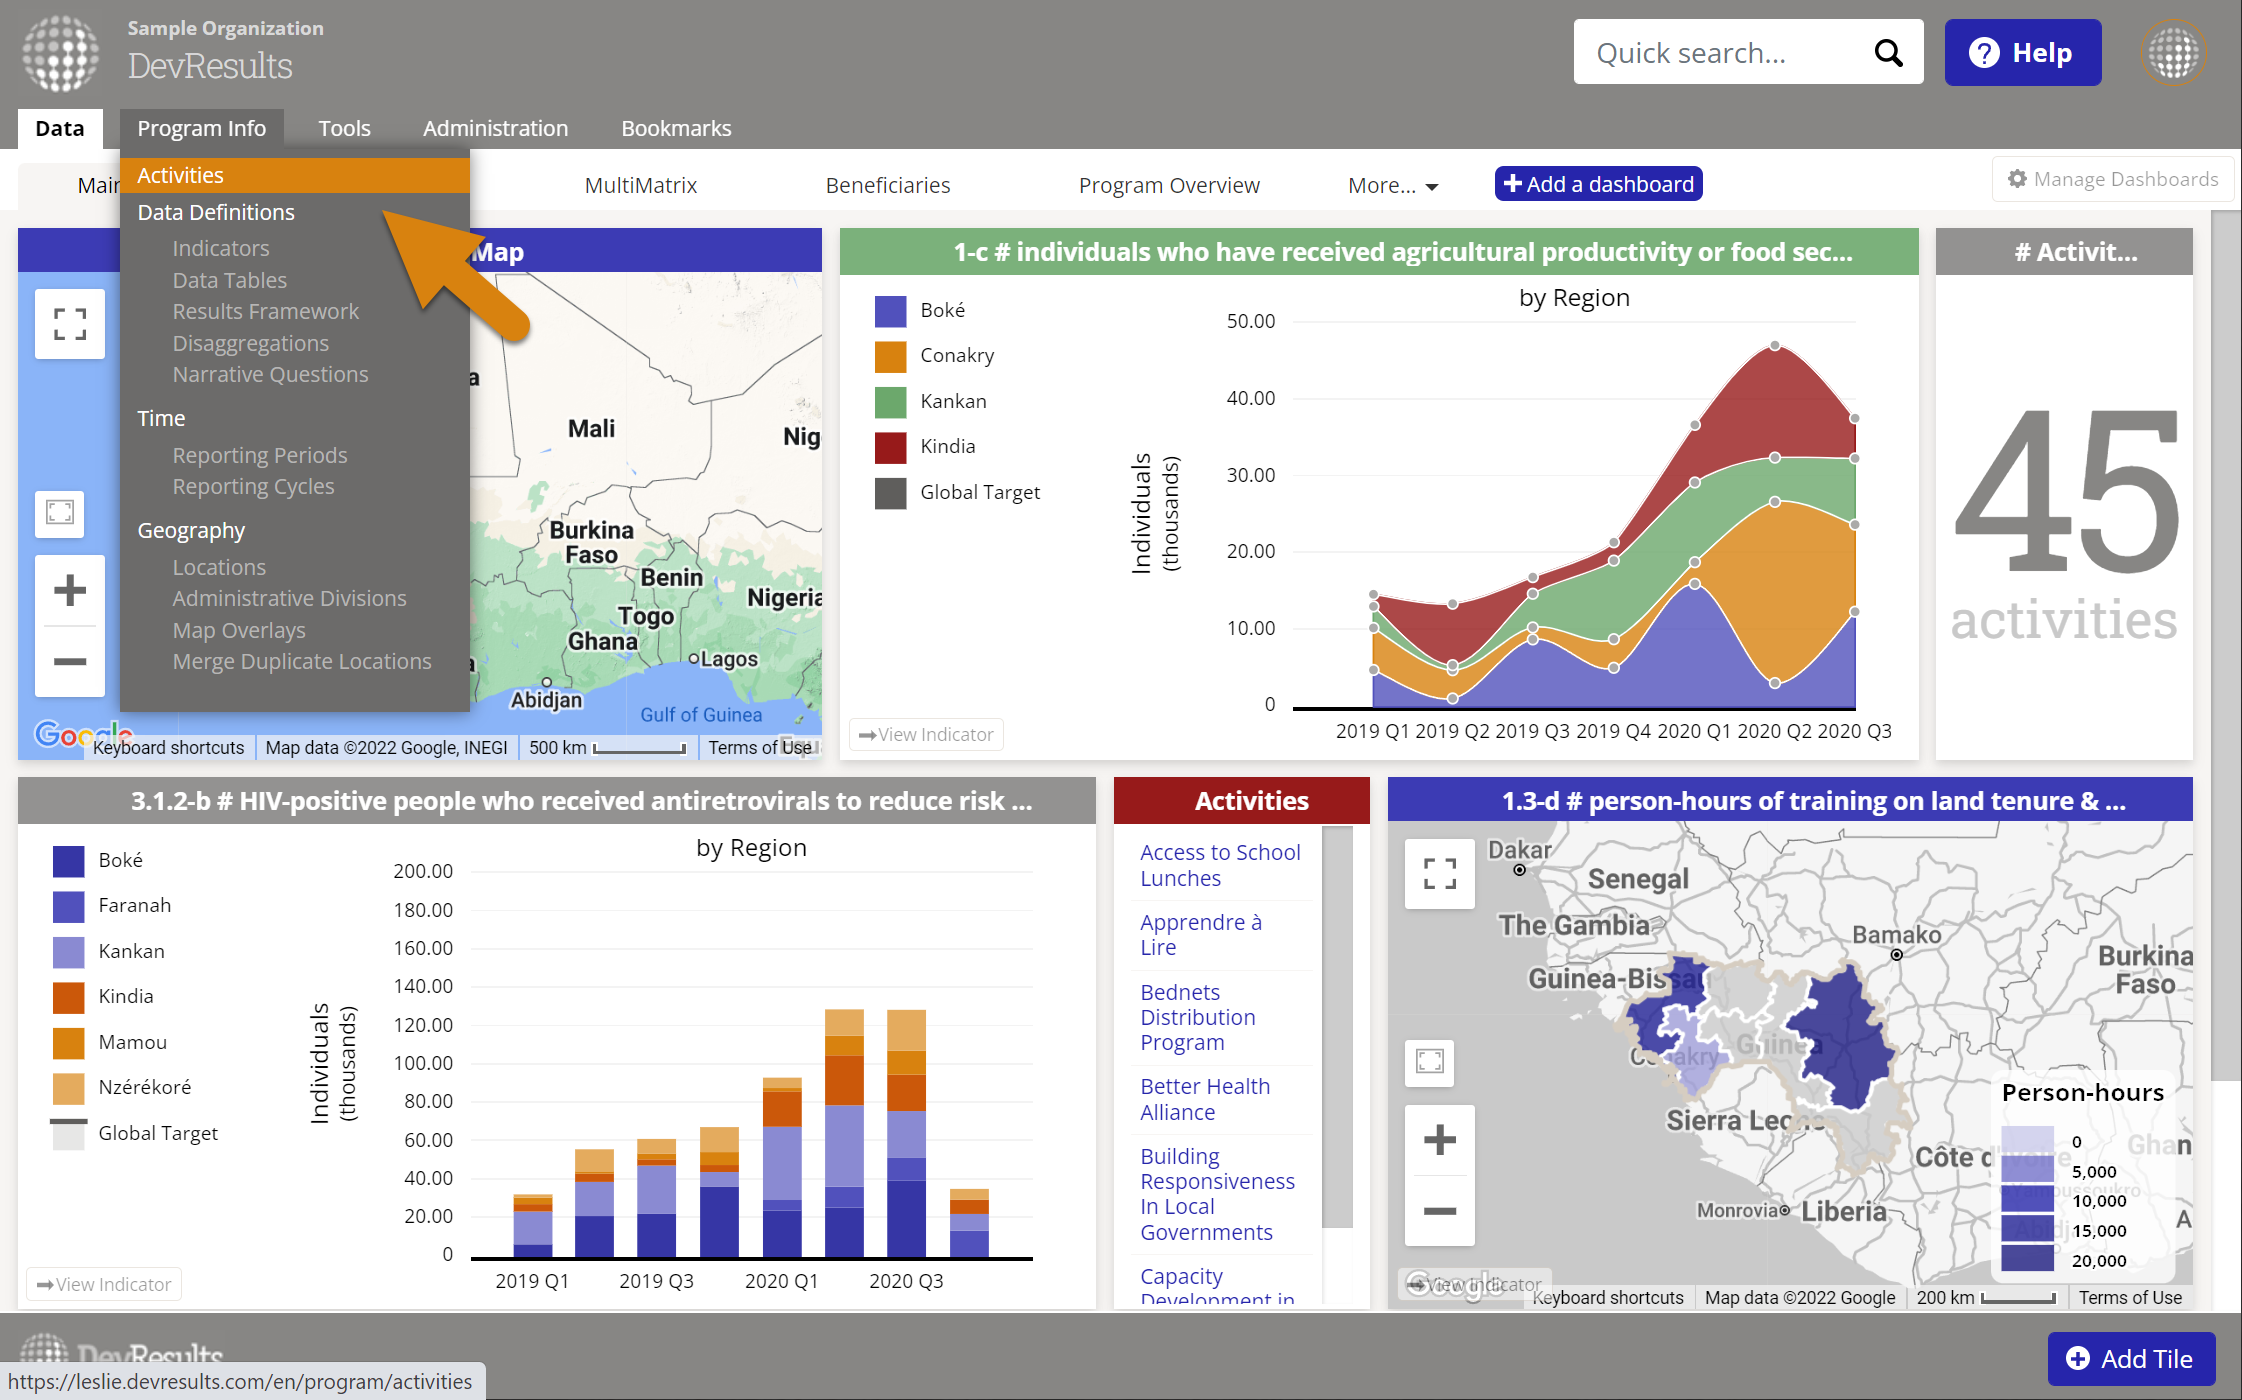
To use the updated project index, navigate to Program Info > Projects.
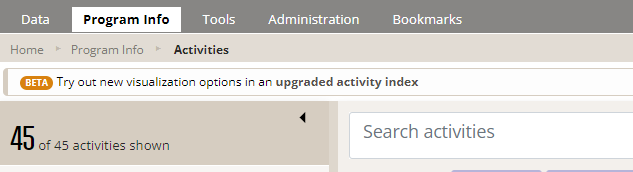
If you're a beta user, you will see an option to try out the upgraded project index above the search option.
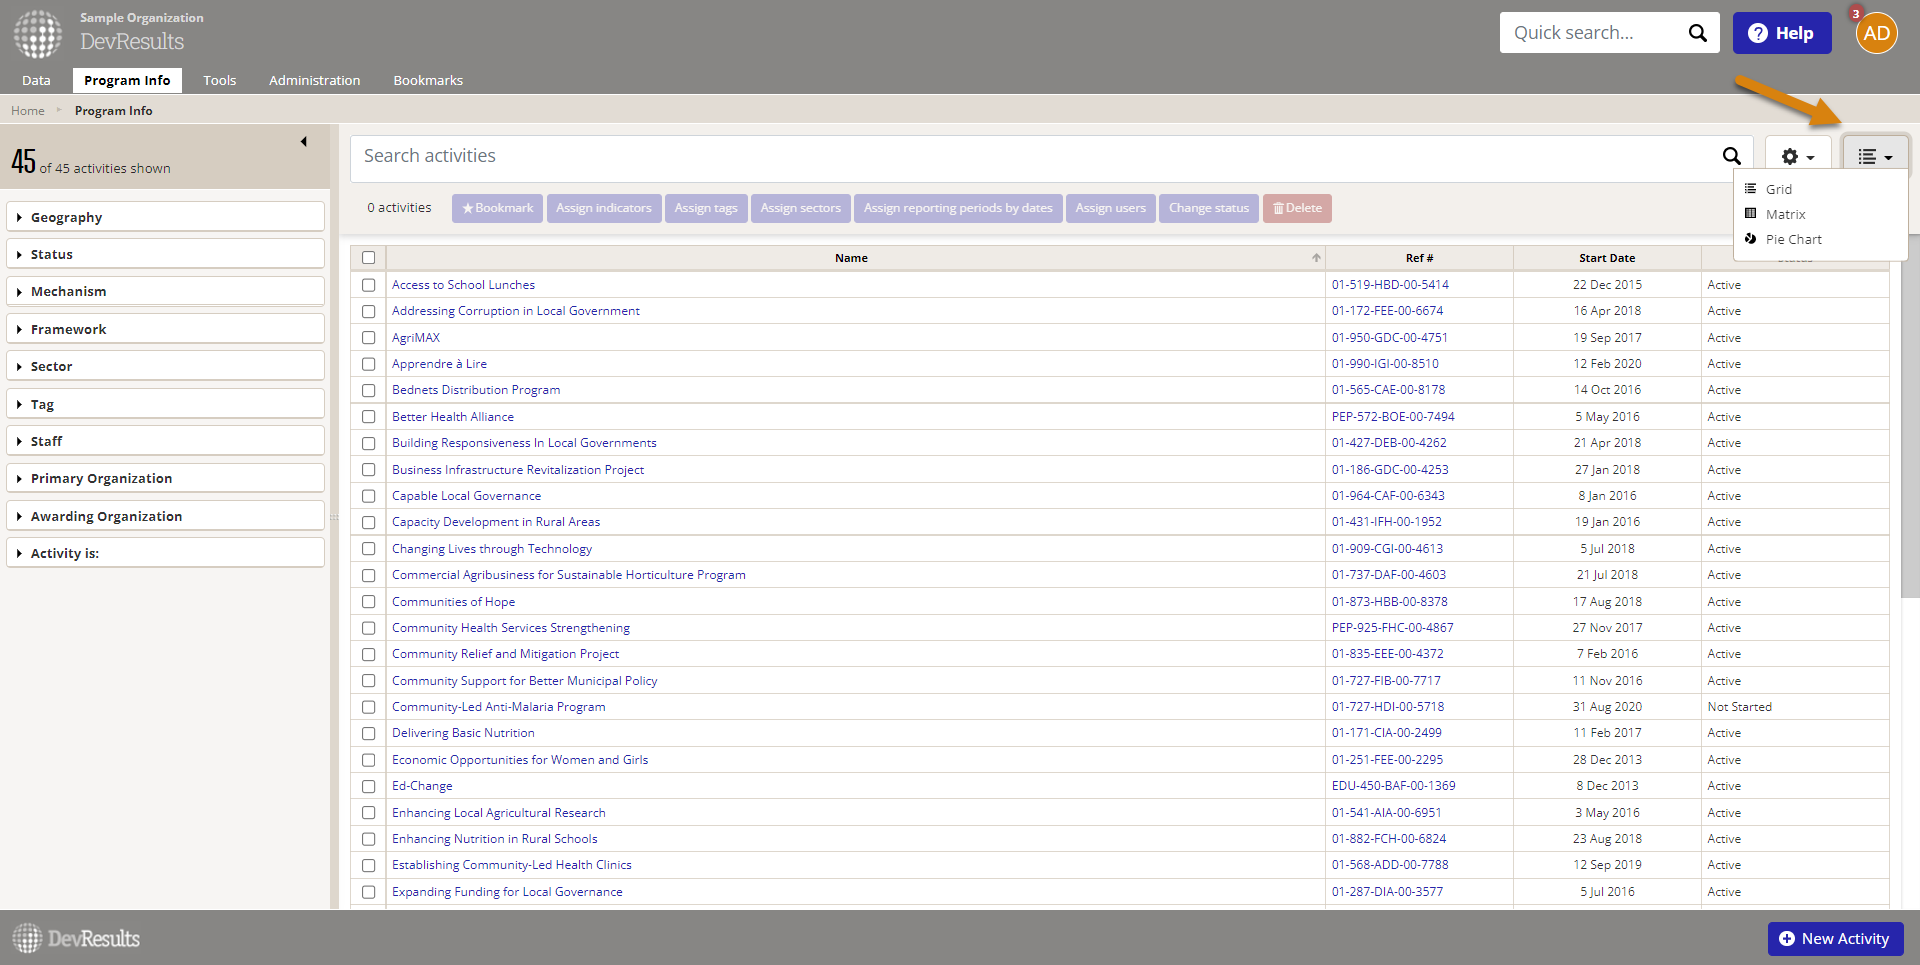
Once you click on the option, the index will reload. Click on the list menu on the far right-hand side. You'll be given options to visualize information either in a matrix or a pie chart.
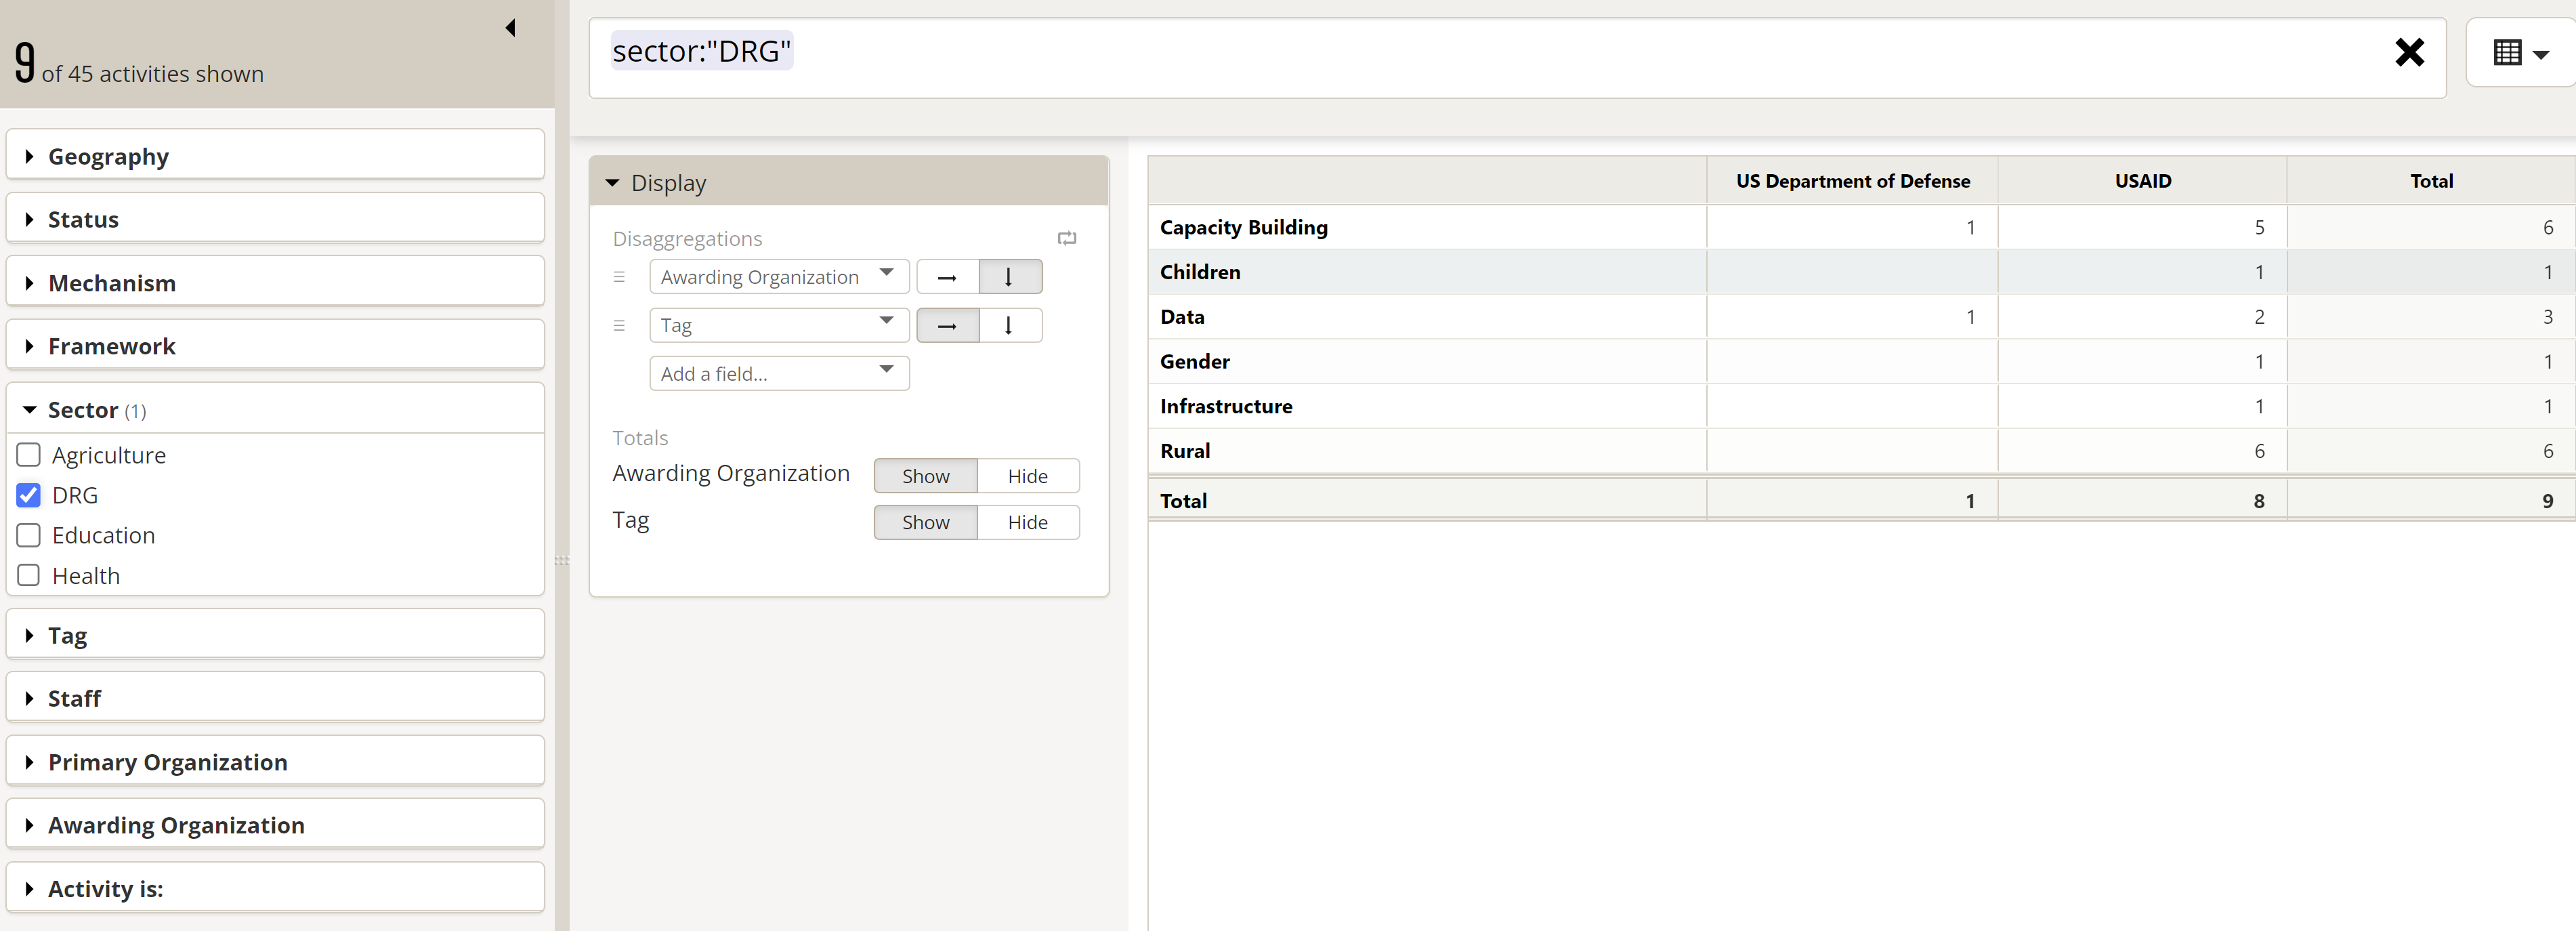
The matrix option will offer a display tool where you can select what fields to add as rows and columns. Once you've selected the relevant disaggregations, you can choose to include or hide totals.
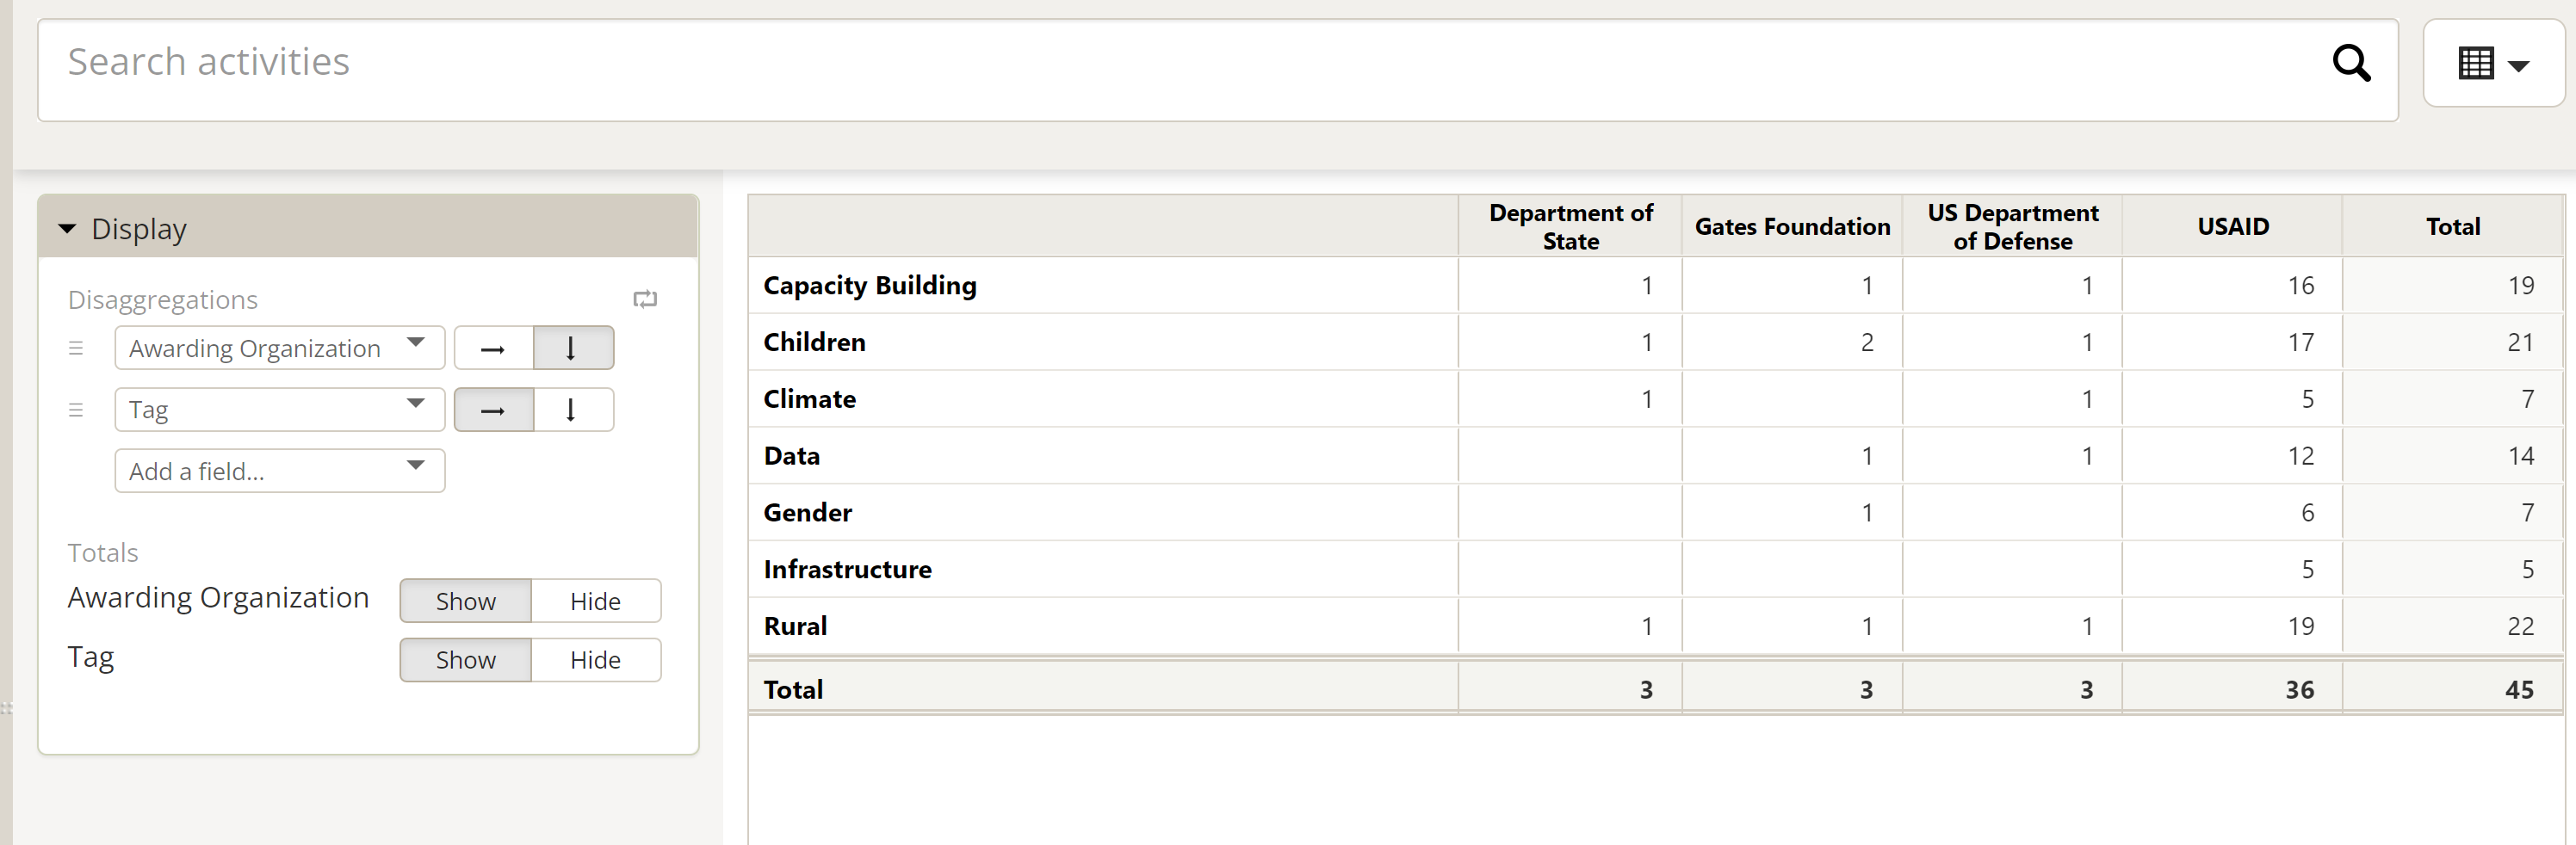
You can also filter the data displayed by using the left-hand side filter selections, or by using the search bar.
Similarly, the pie chart option allows you to display information disaggregated by any of the fields available. You can show or hide the total and change the palette, as you can with any indicator display pie chart.

Didn't answer your question? Please email us at help@devresults.com.