Indicators measure progress toward objectives. This page describes the three sources for an indicator's results in DevResults.
- Direct Entry: for entering numbers each reporting period (e.g. once per quarter, per year, etc.)
- Data Table: for entering lists, surveys, logs, and individual-level records (and then the indicator computes the results based on the table)
- Formula: for calculating results from other indicators, like creating a percentage by dividing two indicators or adding two indicators together for an aggregate result
For other information on defining indicators, see our Indicator Guidebook.
Direct Entry
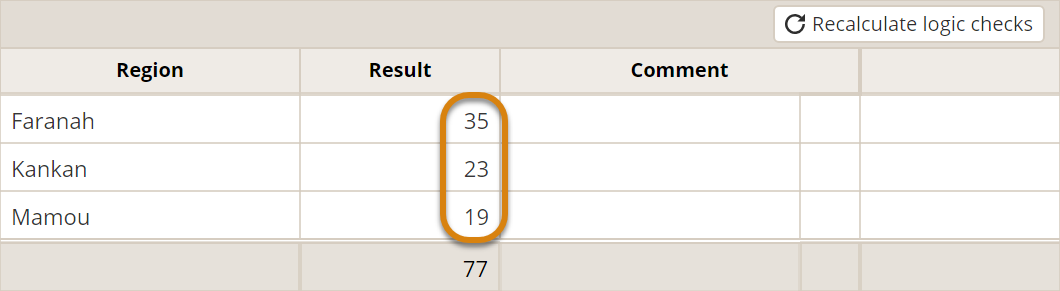
The simplest indicator in DevResults, direct entry indicators are structured for you to report already counted data. For example, consider the indicator # people trained. With a direct entry indicator, you enter numerical results for the geographic place(s) where you report. The total is generated automatically.
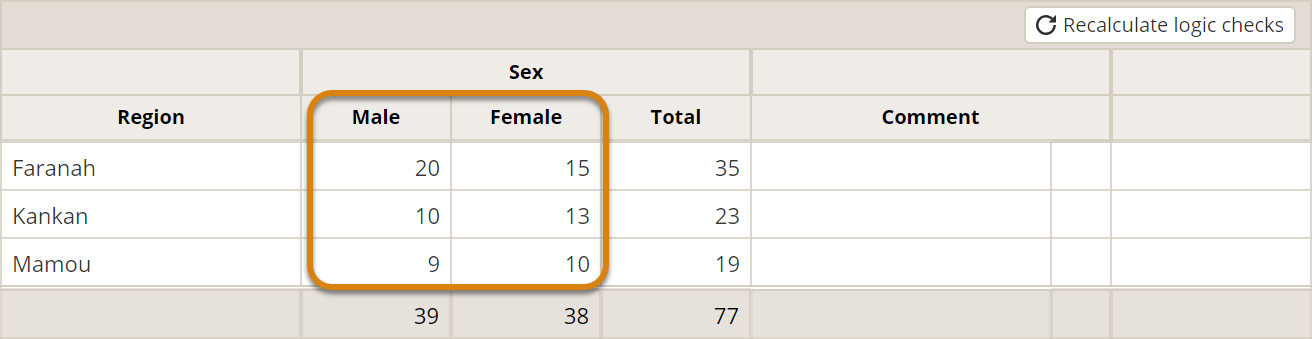
In the case that the indicator is disaggregated, you enter numerical results for each disaggregation category and each geographic place. Again, the totals are generated automatically. Read more about disaggregations.
Strengths & uses
Direct entry indicators are great for working with a partner or department that tracks information in their own system and you just need them to provide the numerical indicator results. In other words, they keep their lists of trainees elsewhere and just report the counts to you. DevResults enforces consistent indicator definitions and disaggregations between reporting periods so you always know that you are comparing apples to apples.
Weaknesses & limitations
Once data is reported, you cannot add or remove disaggregations without triggering a data deletion and reentering data from scratch. The reason is that adding or removing disaggregations is the same as adding or removing columns from the data entry grid. In practice, that would require either splitting or merging existing results, often in ways that cannot be expected or predicted without revisiting the source data which may or may not be available. To avoid creating unreliable data that needs immediate and comprehensive editing, DevResults will instead delete results data when a disaggregation change is made, so you will need to export the results first if you intend to retain them for your records.
Also, having numerical counts without the underlying lists or tables is harder to audit for accuracy.
Data Table
A data table is a list of records that allows you to directly upload spreadsheets of individual-level data. For example, instead of reporting that you trained 10 people, you'd make a list of all 10 people you trained. See complete information about creating a data table.
Once you've created a data table, you can define an indicator that computes results from that table.
Summary
There are two categories of calculations that indicators can use to compute results from a data table.
- Count rows
- You can count all rows in a table. For example: if your table is a list of meetings, then counting all rows would give you the indicator "# meetings held".
- You can count unique sets of rows. For example: a trainee might appear in a table multiple times, but you only want to count her once. You would count unique values in the trainee column to get the indicator "# trainees."
- Do math on a column of numbers
- You can sum or average numbers in a column of a data table. For example: for a table with a column containing test scores, take the average of the column for the indicator "Average test score".
Every data table indicator must specify:
- Which geography column in the table (if there's more than one) should be used for the indicator's geographic disaggregation.
- Which date column (if there's more than one) should be used to put each result in a reporting period.
Data table indicators can also have filters to ignore rows of the data table based on defined criteria. For example, if your table includes males and females but your indicator should only count females, you would create a filter where "Sex = Female".
See complete information about data table indicators.
Strengths & uses
Data tables are useful for storing training logs, survey responses, incident reports, etc. They reduce reporting errors by letting DevResults do the math to calculate indicator results from the table, as well as to calculate values within the table from other columns. Storing complete records provides better information for auditing the veracity of the data. One table can have unlimited columns and can link to unlimited indicators, offering unlimited flexibility. Spreadsheets of records can be uploaded directly to DevResults and information can even come from mobile collection tools or survey platforms.
Weaknesses & limitations
DevResults requires that data tables use variables as headings and observations as rows. This means that each column heading must be a question where the rows contain the answers. For example:
- A column heading can be a disaggregation, but not a disaggregation category. e.g. The column heading would be "sex" and the rows would be filled out as "male" or "female".
- A column heading could be "training date", but not a specific date or timeframe like "1/1/2019" or "2019 Q2". The specific dates belong in the rows.
- A column heading could be "province" but not a specific province like "Eastern" or "Central." The specific places belong in the rows.
Longitudinal tracking requires updating a single beneficiary's record with new test scores or survey answers or creating linked tables. Additionally, data tables do not support survey questions where respondents should select multiple answers at a time. These would have to be formatted as separate columns for each option or using linked tables.
Formula
Formula indicators calculate results using other indicators in DevResults. They can use any other indicators as inputs and you can perform mathematical operations on them such as addition (+), subtraction (-), multiplication (*), division (/), or exponentiation (^). The two most common uses of formula indicators are calculation of percentages or aggregating other indicators.
Percentages
For calculating percentages, imagine the indicators:
- 1-p: % students to pass grade 6
- 1-n: # students to pass grade 6
- 1-d: # students enrolled in grade 6
Here, the percentage can be calculated by dividing "students who passed" by "total students enrolled". An indicator used in a formula is called a "component" indicator. In this example, 1-n and 1-d are component indicators. In DevResults, this scenario looks like:

Aggregates
For calculating aggregates, imagine the indicators:
- 2-t: # people trained
- 2-a: # nurses trained
- 2-b: # doctors trained
- 2-c: # technicians trained
The formula to calculate indicator 2-t would be
[2-a] + [2-b] + [2-c]
Disaggregations
For using disaggregations in formulas, imagine the indicators:
- 3-f: % students enrolled who are female
- 3-a: # students enrolled, disaggregated by sex (male/female)
Reference disaggregations by using the vertical bar or "pipe".
The formula to calculate indicator 3-f would be
[3-a | Female ] / [3-a]
Conditional logic
Conditional statements use the IIF function. Express conditional statements as:
IF(<expression>, <truepart>, <falsepart>)
To create the expression you can use:
| = | Equal to (also ==) |
| != | Not equal to (also <>) |
| > | Greater than |
| >= | Greater than or equal to |
| < | Less than |
| <= | Less than or equal to |
| AND | Boolean "and" (also &&) |
| OR | Boolean "or" (also ||) |
| TRUE | Yes or 1 |
| FALSE | No or 0 |
For using conditional logic in formulas, imagine the indicators:
- 4-a: # places to report more than 10 people trained
- 4-b: # people trained
The formula to calculate indicator 4-a would be
IIF([4-b] > 10, 1, 0)
This means that any time the result for 4-b is greater than ten, a "1" is calculated. If it's less than ten, a "0" is calculated. The total for indicator 4-a would be a count of all the ones, giving the number of the places with more than 10 people trained.
Other functions
Formula indicators also support the following functions (where [x] is the indicator code in brackets):
| abs([x]) | Absolute value |
| ceiling([x]) | Smallest whole number greater than or equal to the specified number |
| exp([x]) | e raised to the specified power |
| floor([x]) | Largest whole number less than or equal to the specified number |
| log([x]) | Logarithm of the specified number |
| log10([x]) | Base 10 logarithm of the specified number |
| round([x]) | Value nearest the specified value |
| sqrt([x]) | Square root; equivalent to [x]^(1/2) |
| max([x],[x]) | Returns the maximum value |
| min([x],[x]) | Returns the minimum value |
Notes
- If a formula indicator has any disaggregations, the component indicators must also have those disaggregations.
- If a formula indicator is cross-disaggregated, the component indicators must also be cross-disaggregated. However, a formula indicator can be parallel-disaggregated even if the component indicators are cross-disaggregated.
- If a formula indicator has a geographic disaggregation, the component indicators must have a geographic disaggregation that is at least as specific. (e.g. If the formula is reported per province, then the components must be reported per province or per something smaller like districts or locations.)
- If a formula indicator is reported per activity, the component indicators must also be reported per activity.
Strengths & uses
- For percentages with denominators that can vary between different places, times, or activities, using a formula is the only way to correctly weight those percentages in any analysis.
- Aggregate indicators offer a way to view totals for an indicator where the indicator definition has changed over time (e.g. the total indicator would be a formula adding together the previous version of the indicator and the current indicator.)
Weaknesses & limitations
Formula indicator calculations are only performed within reporting periods. For example, you can't use a formula indicator to calculate percent change between reporting periods.
Didn't answer your question? Please email us at help@devresults.com.