After you have created a data table, you can design indicators that pull results directly from the data table. This article covers how to:
- Define a data table indicator
- Configure one of four calculation types:
- Count all
- Count unique sets, including:
- Count first
- Count unique per date
- Count unique per reporting period
- Deduplicate across dates
- Sum
- Average
- Apply filters to exclude certain rows of the data table from indicator calculations
Define a data table indicator
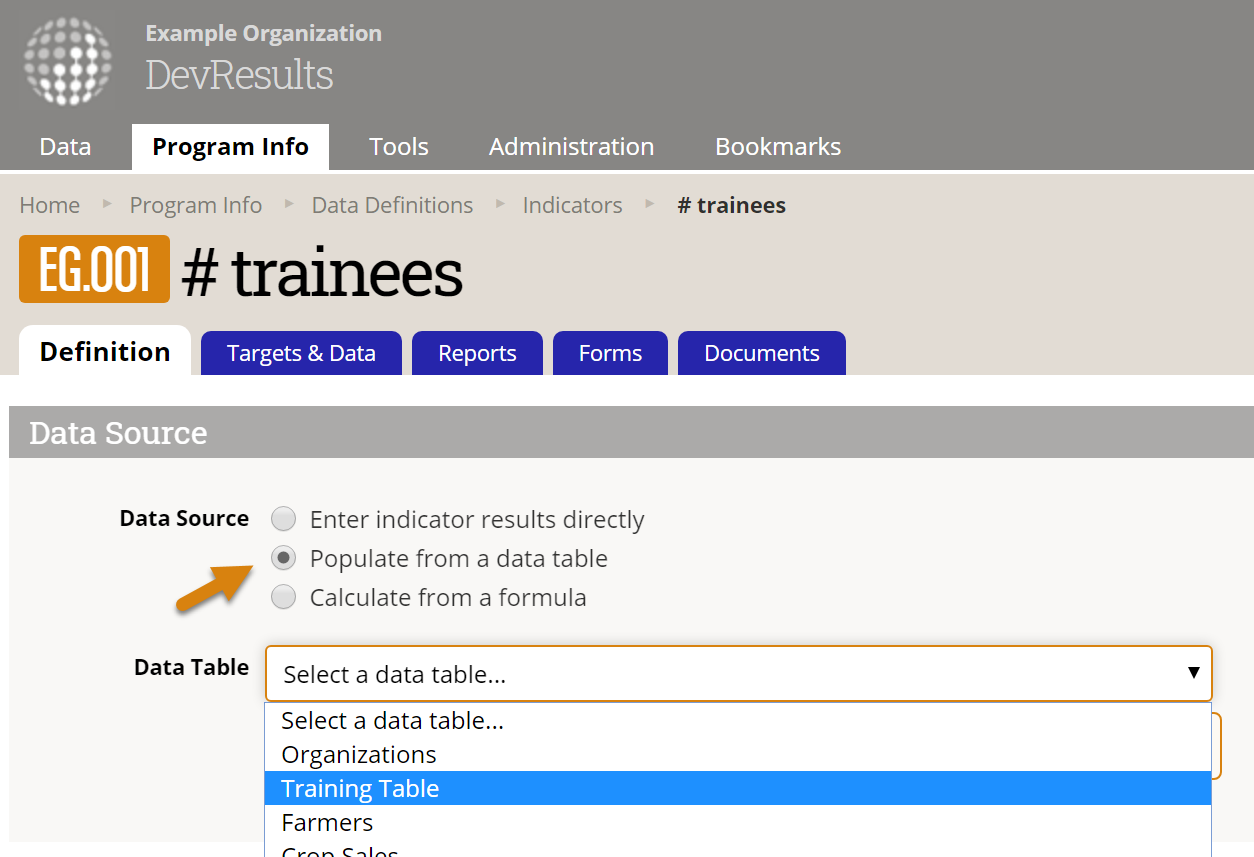
Begin on the indicator's definition page. For data source, select populate from a data table and choose the table that contains information for this indicator.
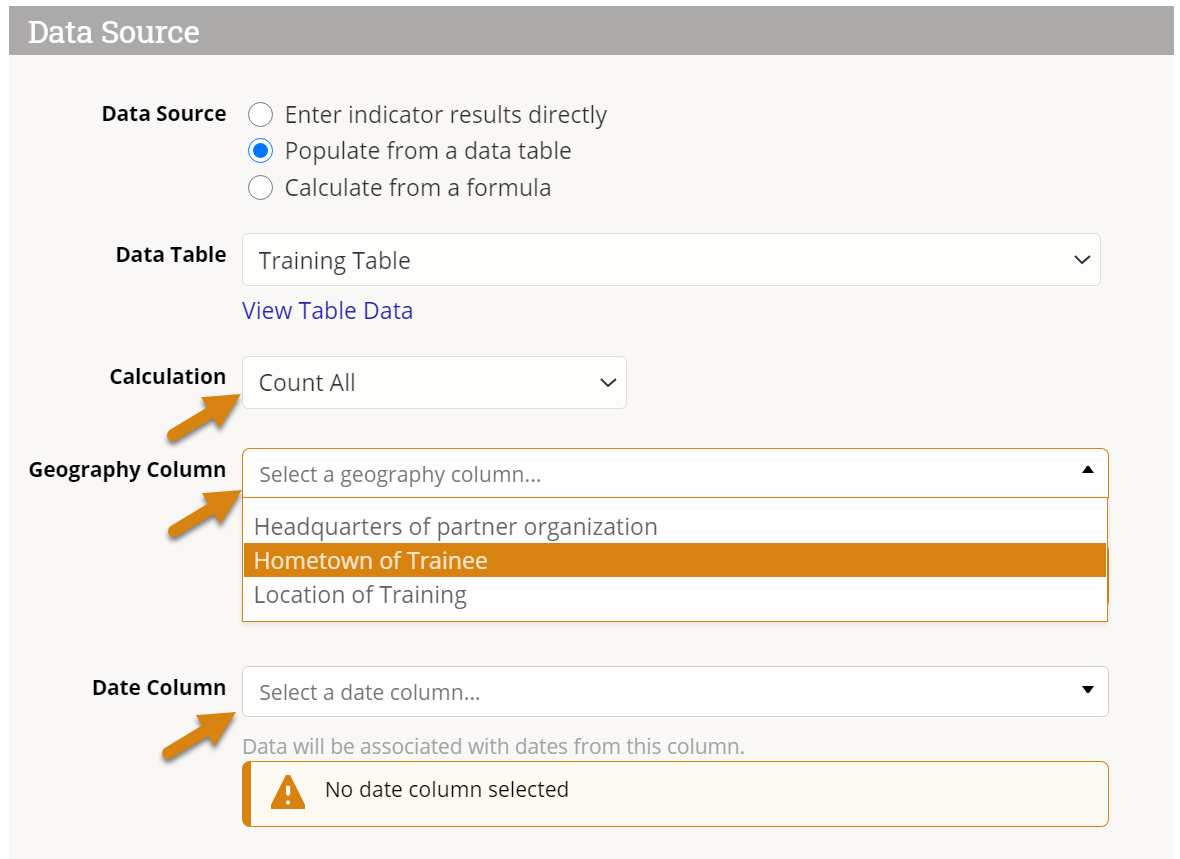
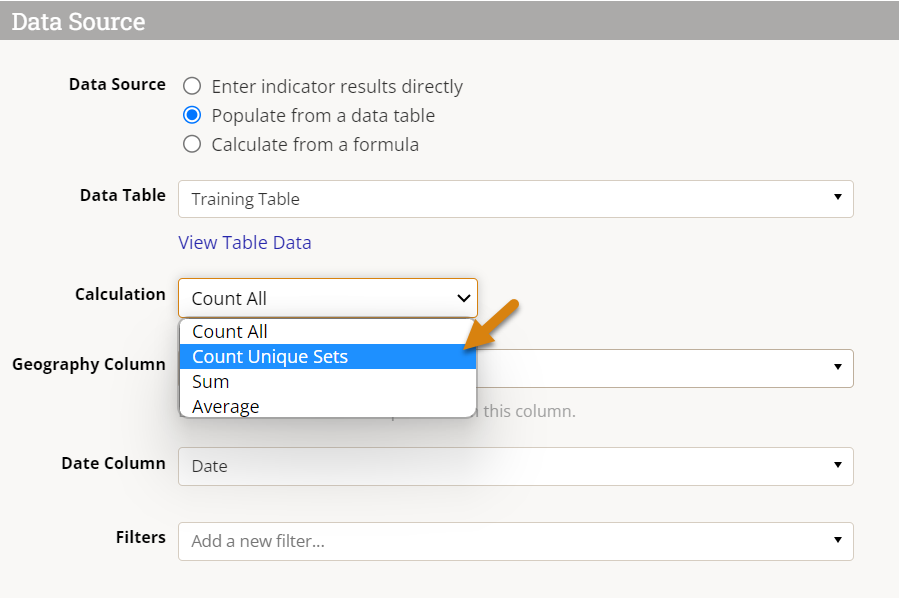
Next, select the calculation. You can either count all rows, count unique sets of columns, or get a sum or average of a column of numeric data. Additional configuration options will depend on which calculation type you use. This example shows the count all configuration.
After selecting the calculation, identify which geography column and which date column should be associated with the indicator results. You must choose these even if your table only has one geography column and one date column. (For example, you would probably choose to report your indicator results by "date of training" rather than "date of birth" for a beneficiary.)
Finally, you can choose to exclude rows from your calculation by applying one or more filters. See the filter section at the bottom for more information.
The rest of the indicator's definition works like any other indicator with three caveats:
- Any disaggregations assigned to the indicator must be included in the data table.
- The geographic disaggregation must either be the same as the geography column selected in the data source section or a geographic disaggregation that's less specific. For example, if the data source geography column is "district", the indicator could be reported per country, but not per location.
- If the indicator is reported per project, there must be a project column in the data table.
Note: any rows missing data in a column relevant to the indicator definition (such as the date, geography, or a disaggregation) will be ignored when indicator results are calculated.
Data table indicator calculation: Count all
The Count All calculation counts all rows in your data table. (The same caveats apply for any indicator: rows of data are excluded from the calculation if they don't have complete information for all columns relevant to the indicator definition, or if filters are applied).
To create a count-all indicator, set the data table Calculation to Count All.
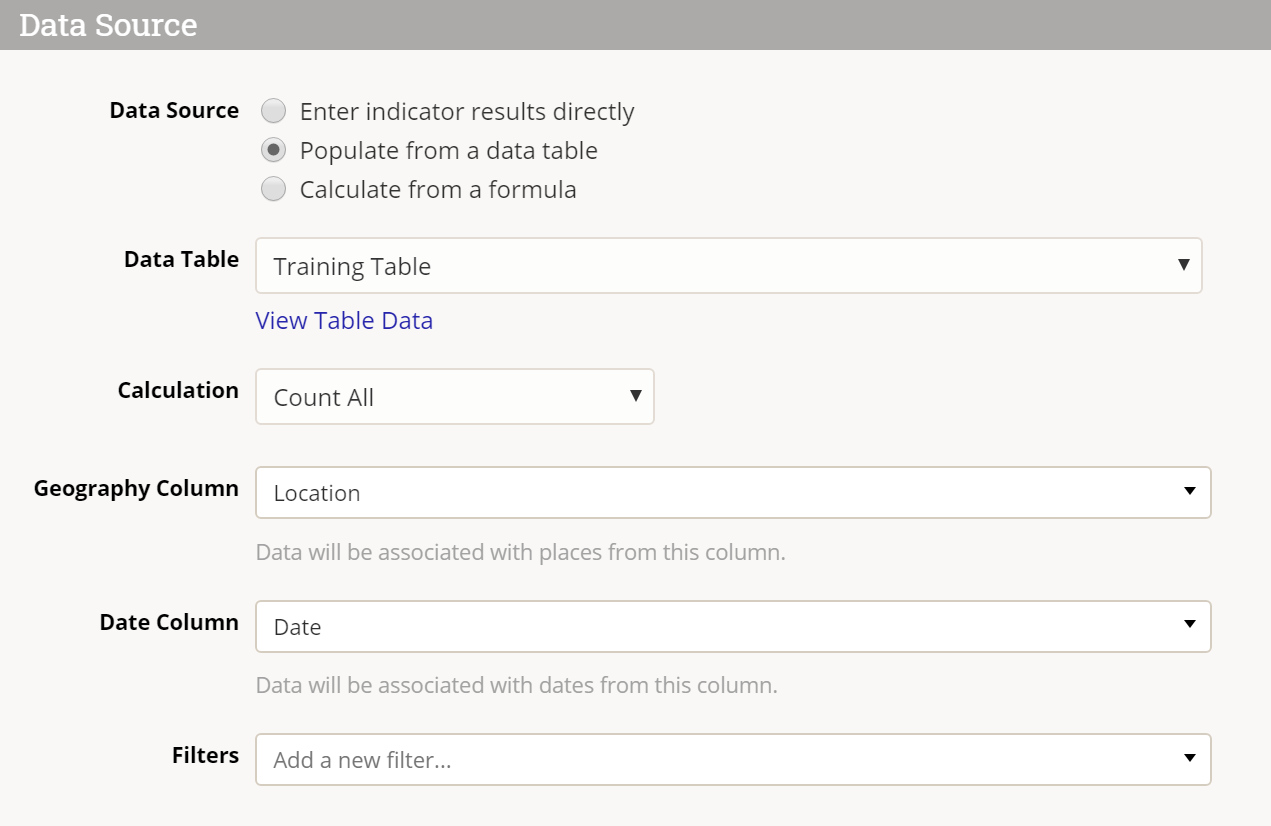
The result for this indicator mapping will be a count of all the rows in the data table.
Have a look at this Training Table:
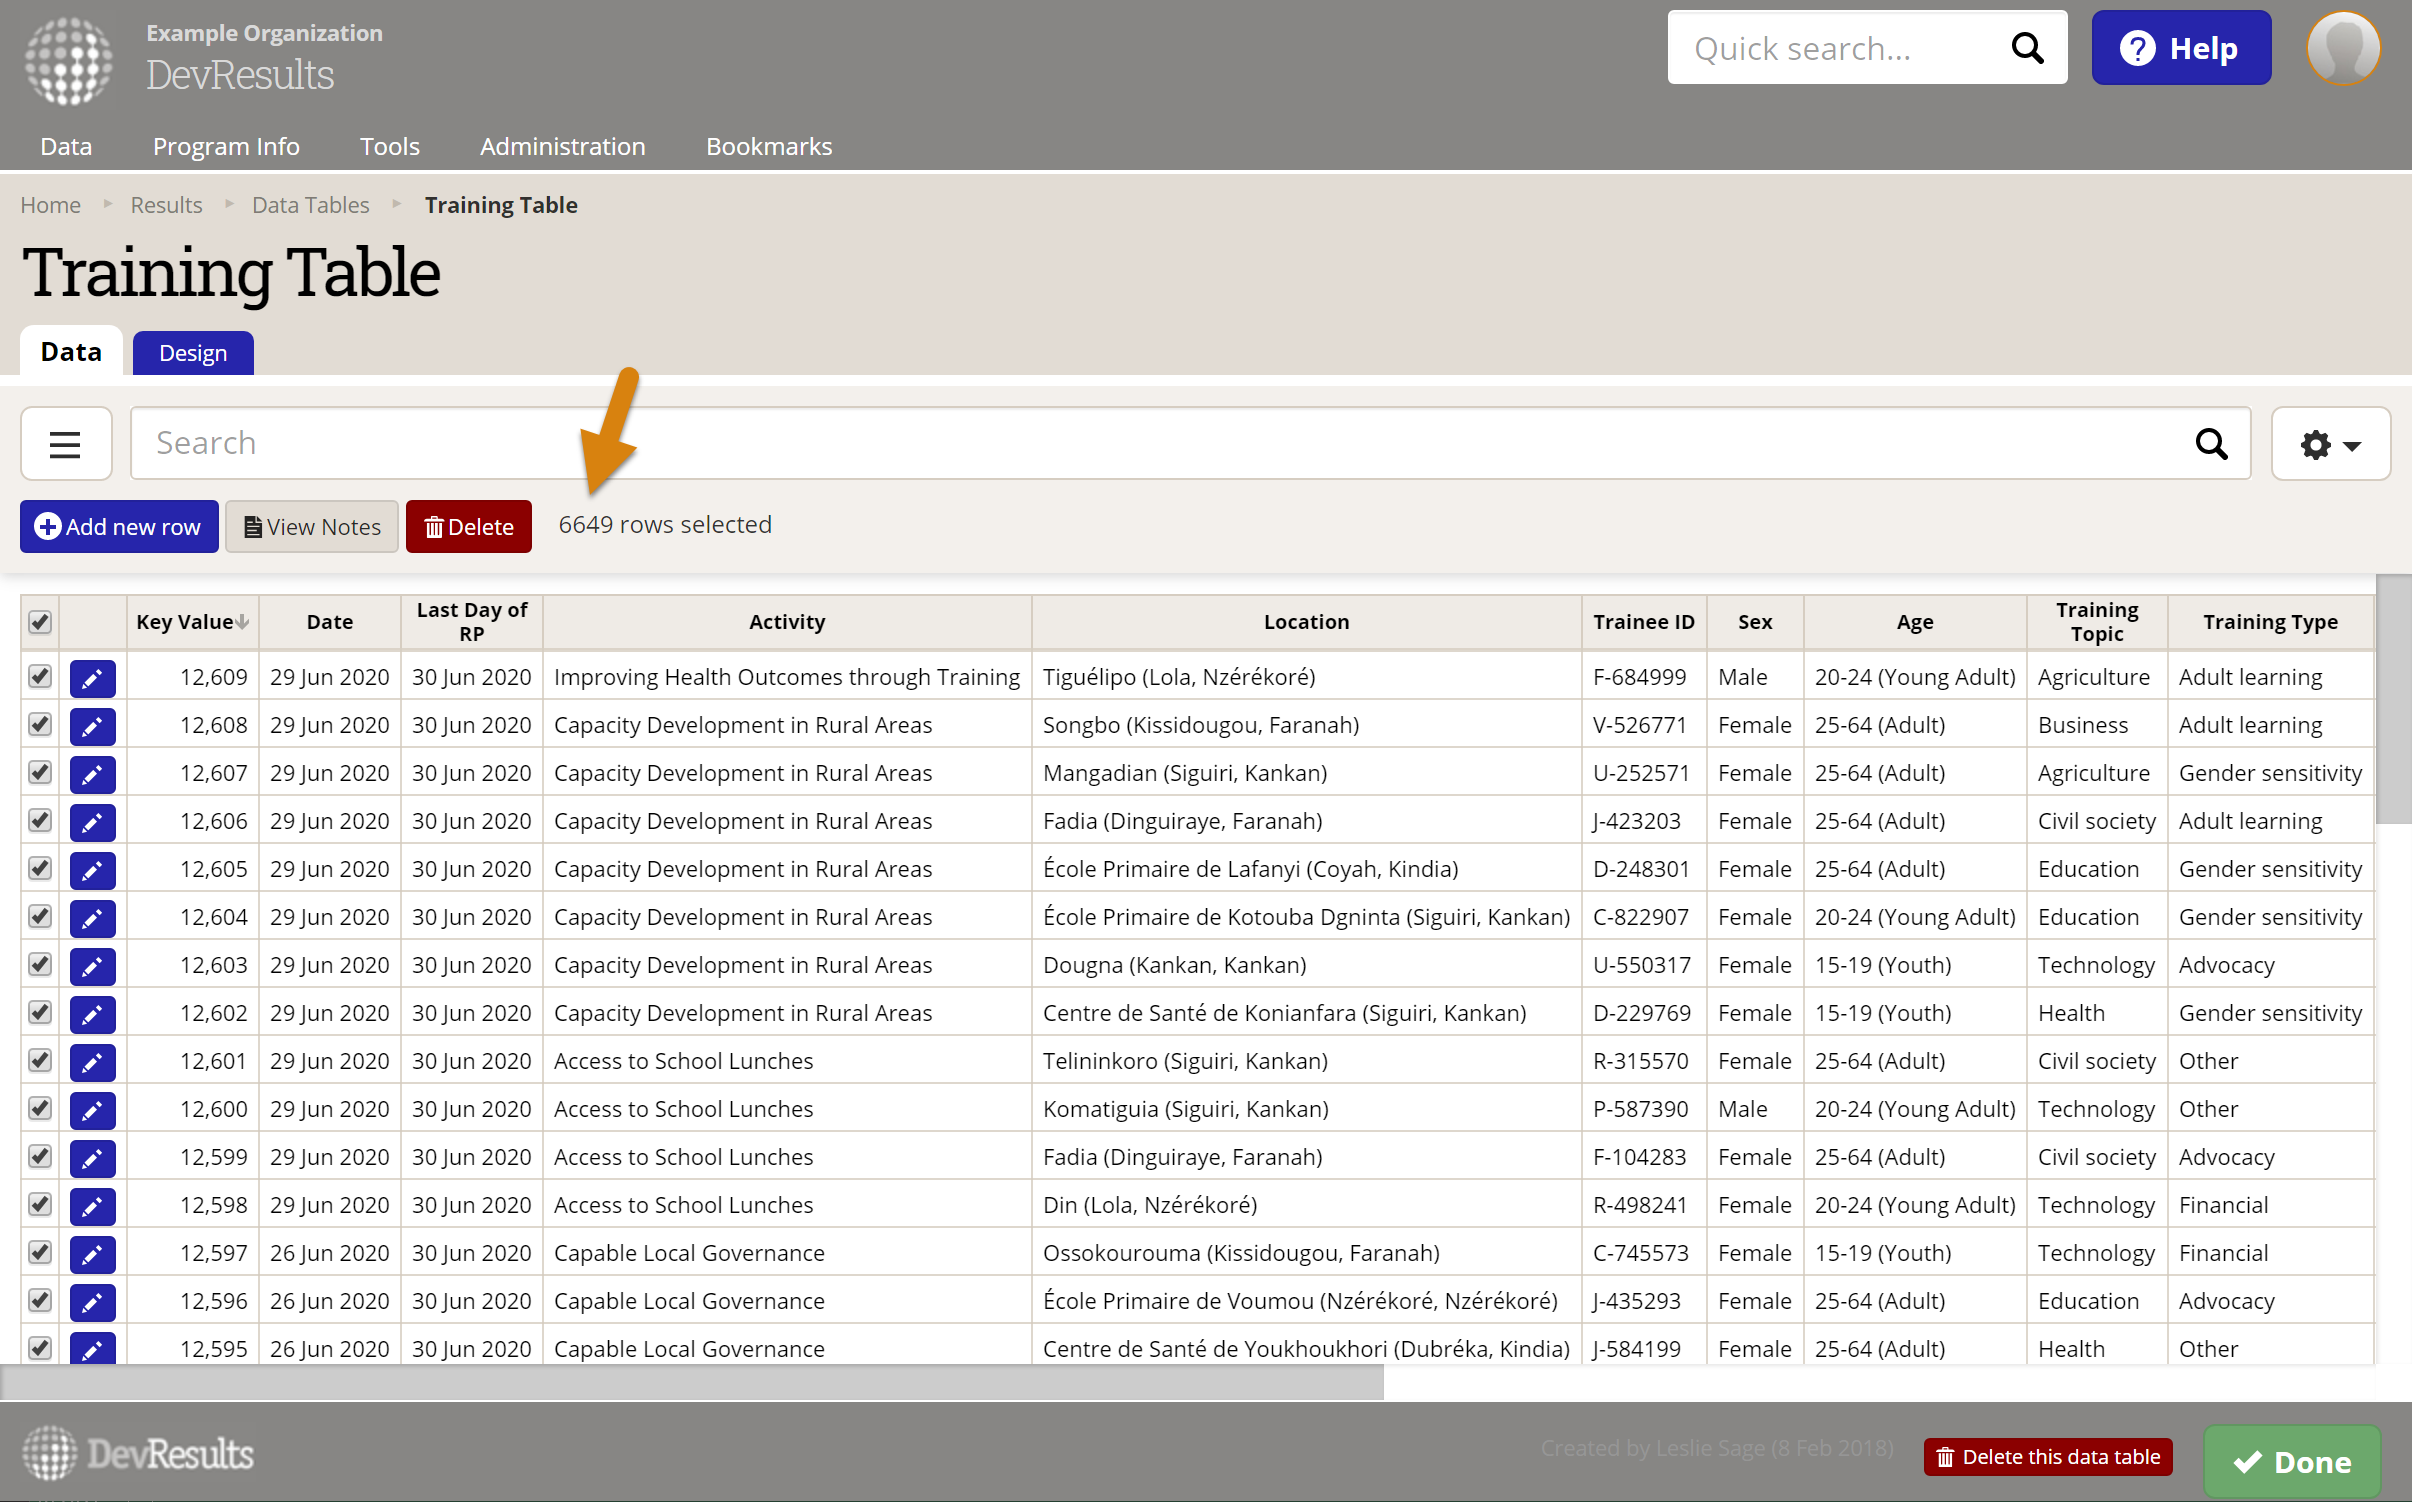
There are 6649 rows, so Count All would give the result of 6649 (if all the relevant columns are filled out).
Data table indicator calculation: Count unique sets
The Count Unique Sets calculation lets you avoid certain kinds of double counting when generating results from a data table. For example, if you train someone multiple times but only want to count them once, Count Unique Sets can not only deduplicate these results, but adjust how and when they are counted.
How Does 'Count Unique Sets' Work?
Count Unique Sets looks at the combination of fields selected as Count Unique Columns and then counts each identical set only once within the time period defined by the selected Count Type. For example, if you have a training table and select First Name and Last Name as your Count Unique Columns, you can use the Count Type dropdown to count training participants four different ways:
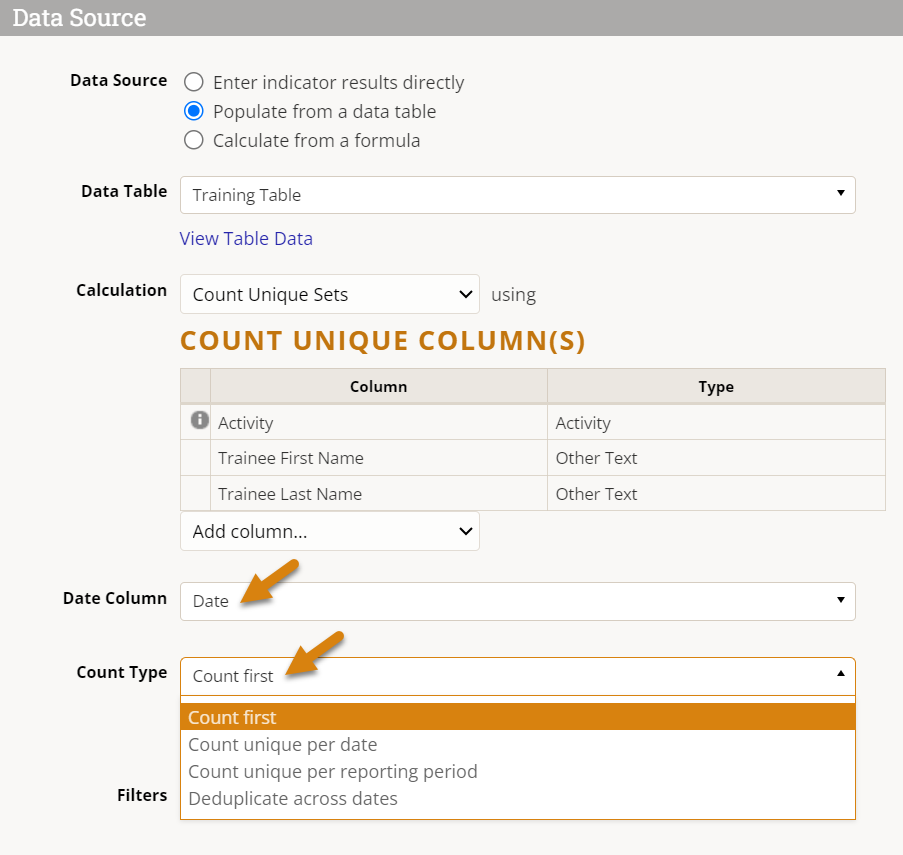
- Count first: Each set will only be counted for the earliest date in the selected Date Column and the reporting period that contains it. Only one training for each person will be counted, and all subsequent trainings for the same person will be ignored.
- Count unique per date: The selected Date Column will be automatically added to the Count Unique Column list, then sets that share a date will each be counted once. Multiple trainings for the same person on the same date will be deduplicated.
- Count unique per reporting period: The selected Date Column will be converted to the appropriate Reporting Period and automatically added to the Count Unique Columns list, then sets that share a reporting period will each be counted once. Multiple trainings for the same person in the same reporting period will be deduplicated, but multiple trainings for the same person across different reporting periods will each be counted.
- Deduplicate across dates: Each set will be deduplicated and associated with the latest date from the selected Date Column. Multiple trainings for the same person will be deduplicated across all time, but the result will exist entirely within a single recent reporting period (compare to count first which distributes the data across reporting periods based on first participation.)
For more detailed examples of various types of counts, see Count Unique Sets Examples. Basic configuration of a Count Unique Set indicator is demonstrated below.
Note: If you use count unique per reporting period, you no longer need to include a "Last day of reporting period" or similar column in your data table. This "Last day..." column is a clever way to take different actual event dates and convert them to a single date which represents the reporting period itself; there is now an explicit count type that does this conversion for you.
Configure a Count Unique Sets Indicator
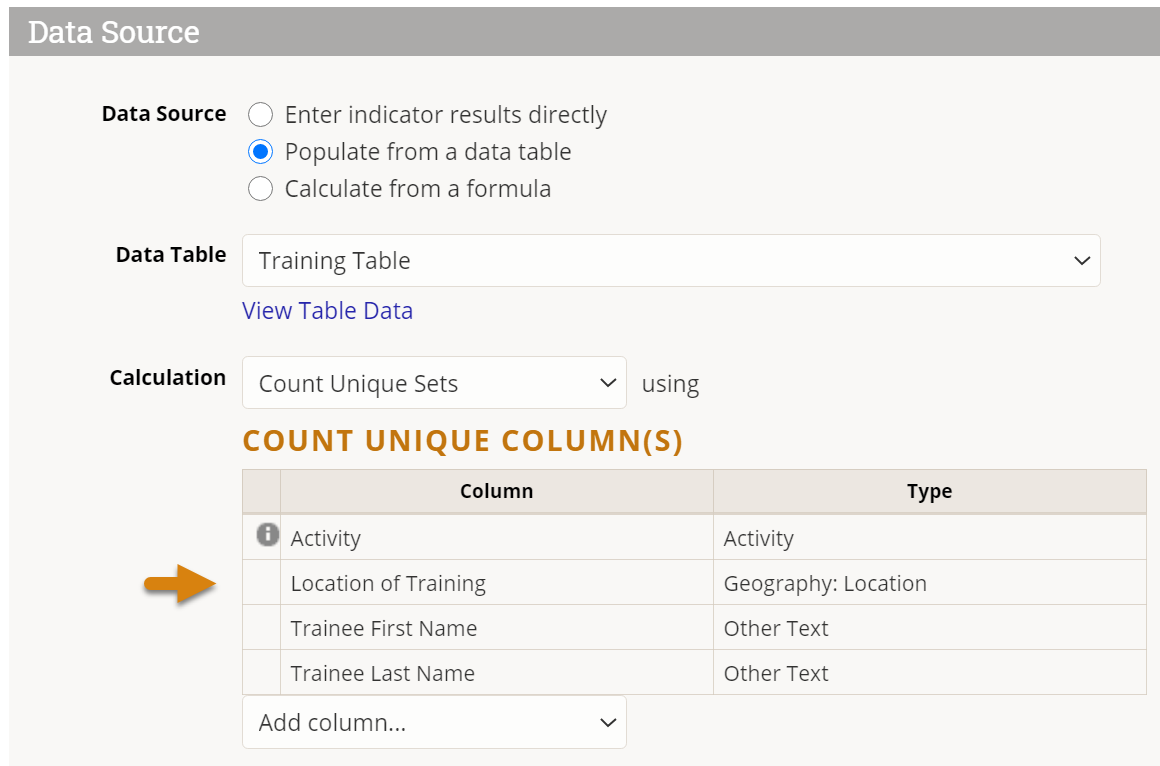
To create a count-unique-sets indicator, set the data table Calculation to Count Unique Sets.
Once you select Count Unique Sets in the calculation, this might add some Count Unique Column(s) for you:
- By default, if the indicator is set for Results are reported separately for each project, the Project column will be added and not removable from the Count Unique Columns. To remove Project here, you will need to uncheck the appropriate box in the Disaggregations section.
- If any disaggregations are assigned to the indicator, these will also be automatically added to the Count Unique Columns. To remove the disaggregation from the Count Unique Columns, remove it from the Disaggregations section of the indicator.
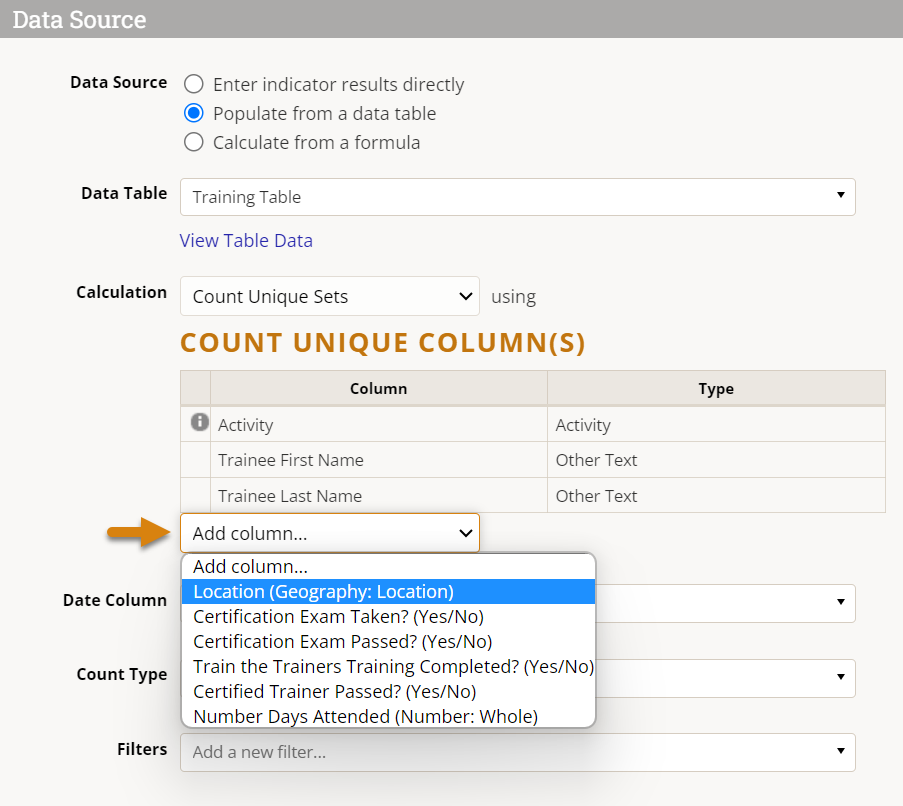
- Geography columns (if present) will not be automatically added, but may be necessary depending on your indicator definition and geographic disaggregation. Generally speaking, you will likely need to add a geography column to the Count Unique Columns list unless you are collecting top-level results only (e.g. national or global level results only, depending on your site's largest geographic extent).
Add columns that uniquely identify your rows, but ignore any date columns for now. For example, the definition below will take the Project + Trainee First Name + Trainee Last Name to determine the unique sets, deduplicating any records with the same name and same project. This will not deduplicate records that have the same name but different projects. If this definition of uniqueness isn't specific enough (for instance, if multiple attendees had the same name), additional fields could be added to distinguish them, such as Location.
Select a Date Column from the available date formatted fields (if multiple). If your table only has one, it may already be selected for you. The Date Column you choose is used to associate your data with reporting periods for that indicator.
Then select a Count Type. This choice determines how the date column will be used to associate date with reporting periods. See above for definitions of each count type.
Note: If your indicator is set to report at any Geographic Disaggregation below your top level, you will need to include a Geography column from your data table in your Count Unique Columns for it to calculate properly. If you don't, you'll see a warning like this:
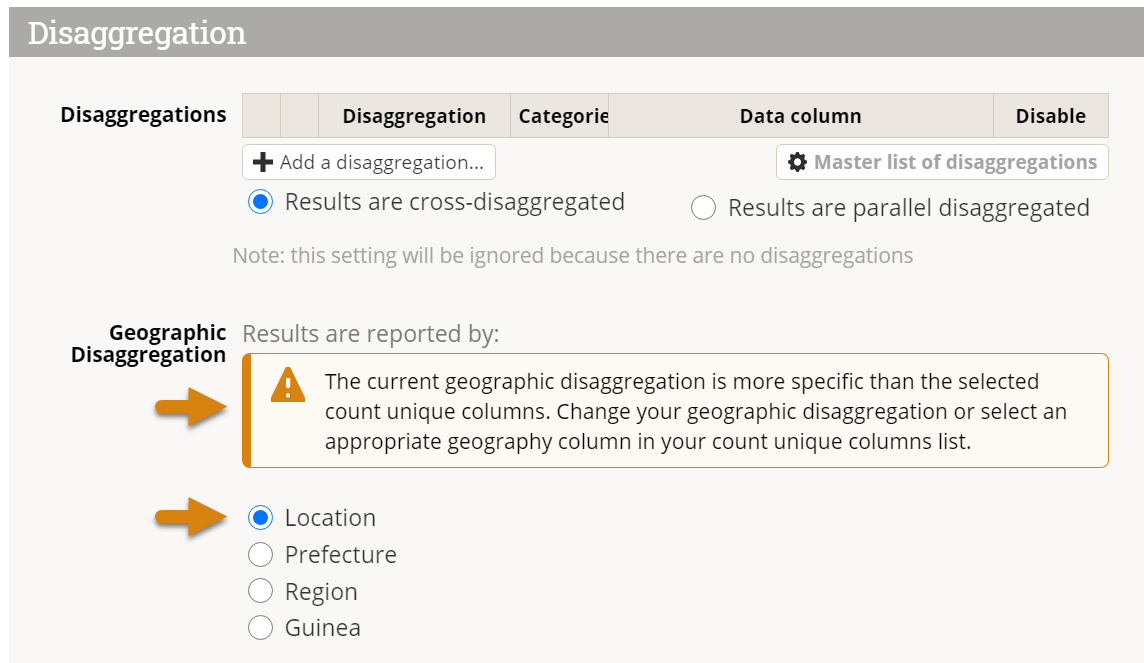
To fix this error, add the appropriate geography column to your Count Unique Columns list.
Troubleshooting Tips for Count Unique Columns
- If you use the count type deduplicate across dates, the calculation results are assigned to the most recent date in the data table, without any time series or historical data.
- If you don't count unique per geography, the calculation results are assigned to the largest geographic division in the system, such as the whole country or the whole world.
- If the indicator is designated to be reported per project, then the calculation generates separate unique counts for each project.
- You can still add filters as usual so that the indicator calculation ignores any rows of data that do not meet the filter criteria.
- Rows of data are excluded from the calculation if they don't have complete information for all columns relevant to the indicator definition.
Data table indicator calculation: Sum
The Sum calculation gives a total of a numeric column in your data table.
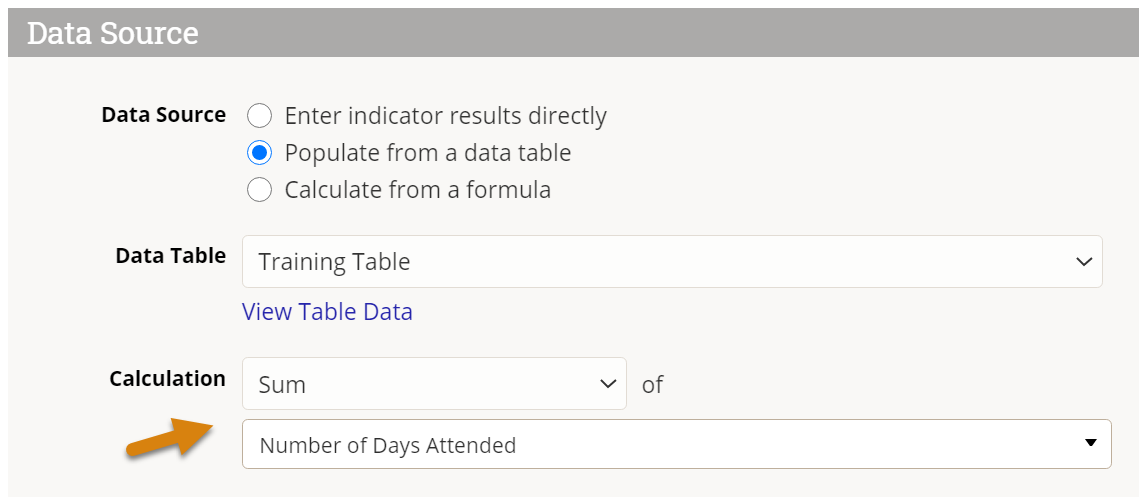
To create a sum indicator, set the data table Calculation to Sum and select the column of data to be totaled. The dropdown only includes columns defined with numeric formats.
What result do I get from Sum?
The result for this indicator mapping will be a sum of the values in the Number Days Attended column. In reports, the results can be subdivided by reporting period and geographic place, plus by project and by any other disaggregations if relevant.
Rows of data are excluded from the calculation if they don't have complete information for all columns relevant to the indicator definition, or if filters are applied.
Data table indicator calculation: Average
The Average calculation gives an average of a numeric column in your data table.
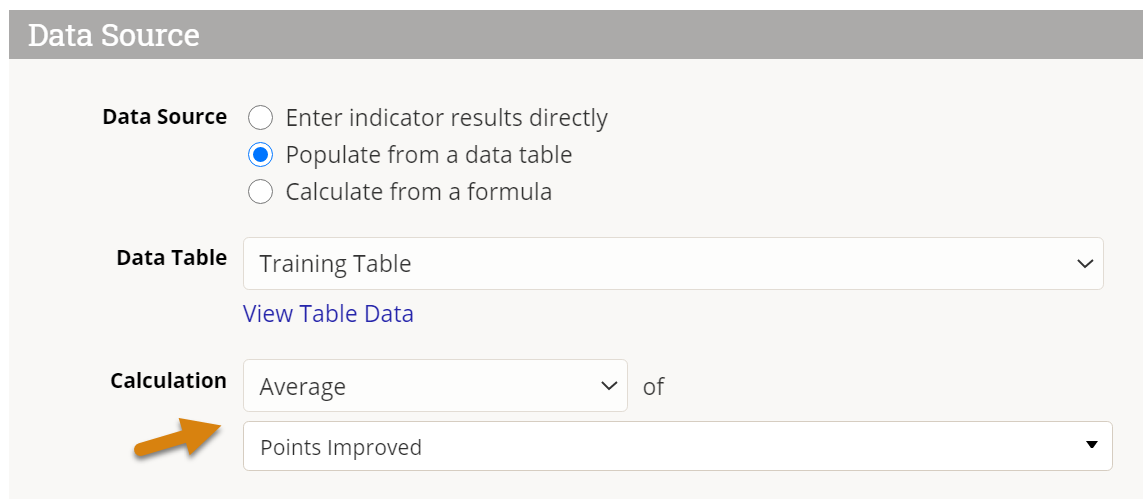
To create an average indicator, set the data table Calculation to Average and select the column of data to be averaged. The dropdown only includes columns defined with numeric formats.
What result do I get from Average?
The result for this indicator mapping will be a average of the values in the Points Improved column. In reports, the results can be subdivided by reporting period and geographic place, plus by project and by any other disaggregations if relevant.
Rows of data are excluded from the calculation if they don't have complete information for all columns relevant to the indicator definition, or if filters are applied.
Apply filters
Indicators populated from a data table can filter rows to include only those relevant to your indicator. For example, an indicator that counts number of women should have the filter "Sex = Female" in a table that includes both females and males. You might not need any filters, or you might need one or more filters depending on your data table and your indicator.
A filter should express the data that you want to include. You can create a filter based on any field from a data table, though it is not advisable to use "Other Text" fields as spelling errors, typos, or bounding quotation marks (" ") will yield unexpected results.
Filters can use one of four operators:
- = (equal-to)
- ≠ (not equal-to)
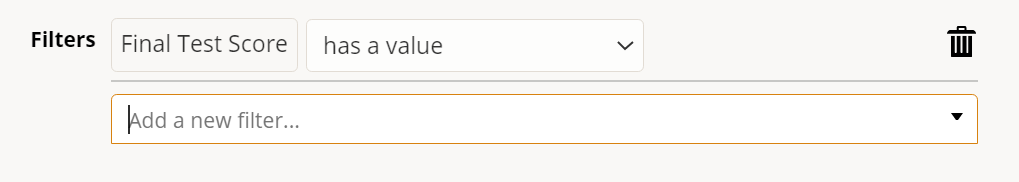
- has a value (not null)
- has no value (null)
In this example, the indicator will only count trainees who have a final test score reported. You could also count only young adult trainees with the filter "Age = Young Adult", or select only those trained in business administration with the filter "Training Type = business administration".
Multiple filters
When combining multiple filters, you can use either AND or OR logic (but not both).
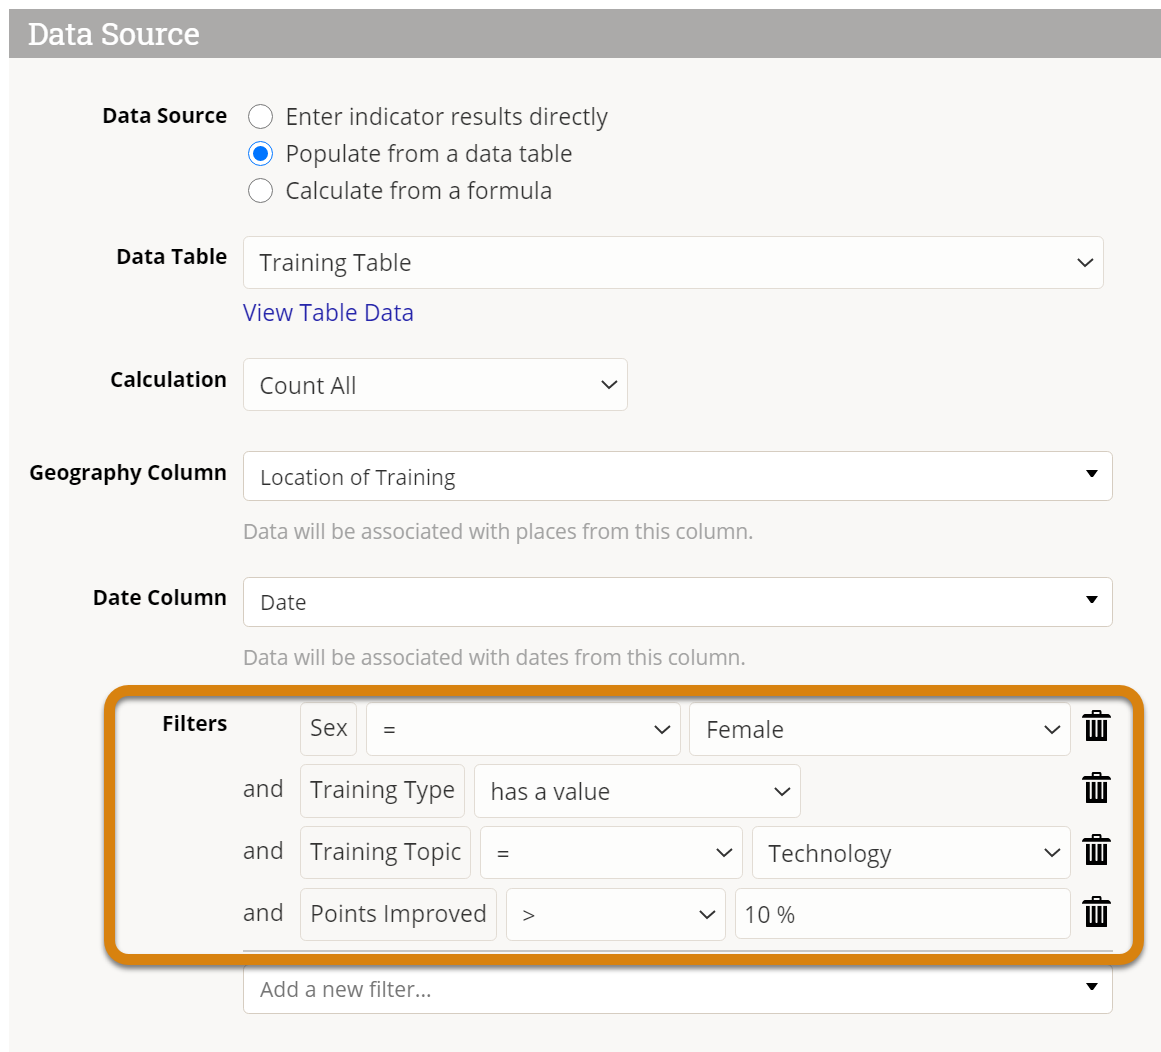
By default, multiple filters will be combined using 'AND' logic, meaning that only a row of data that meets ALL of that criteria will be included in the count. In the example below, all trainees will be excluded except for:
- Those who are female,
- and where the training type was filled out,
- and the training topic was "Technology",
- and the trainee improved more than 10 percentage points.
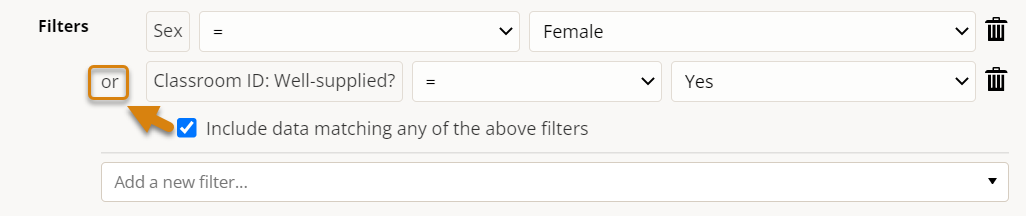
Alternatively, 'OR' logic can be enabled by checking the option to "Include data matching any of the above filters." Rows of data that meet ANY of the criteria will be included in the count. In the example below, trainees would only be excluded if they were neither:
- Female
- Attending a training in a well-supplied classroom
In other words:
- A female trainee in a classroom that is well-supplied would be counted (meets both criterion)
- A female trainee in a classroom that is not well-supplied would be counted (meets first criterion)
- A male trainee in a classroom that is well-supplied would be counted (meets second criterion)
- A male trainee in a classroom that is not well-supplied would not be counted (does not meet either criteria)
Troubleshooting
A common error arises when using multiple indicator filters on the same data table column. For example, if you want to create an indicator that counted rows where the service type is "nutrition" or "health", you might include two filters:
- Service Type = Nutrition
- Service Type = Health
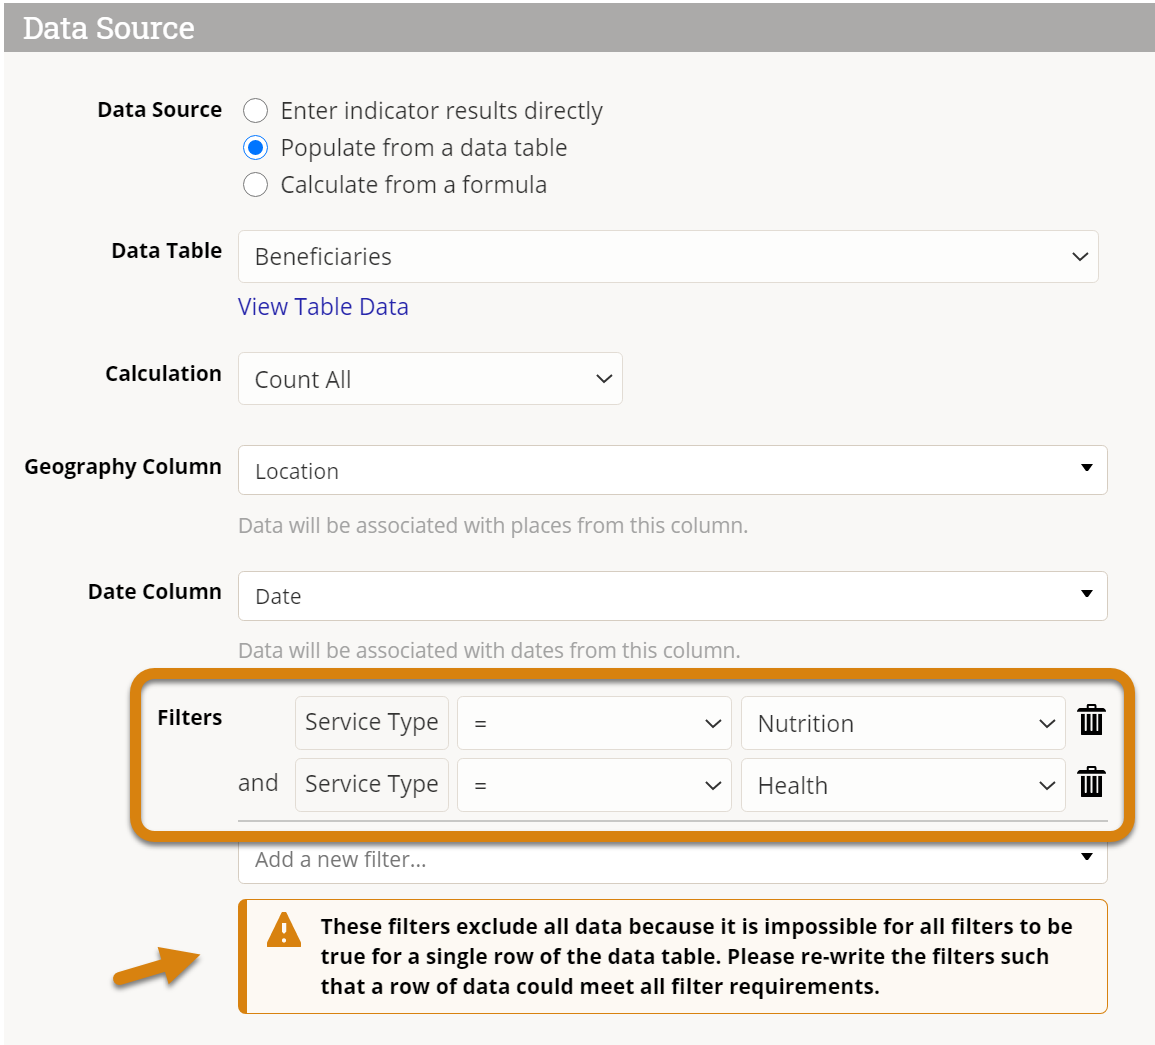
The problem is that no rows could have both nutrition and health for the service type at the same time. Any individual row could only have either nutrition or health as the service type, but not both. Since all of the filters must be true for a row in order to count that row toward the indicator result, this configuration would give you zero results.
How do you fix it? Look a the disaggregation categories for this disaggregation.
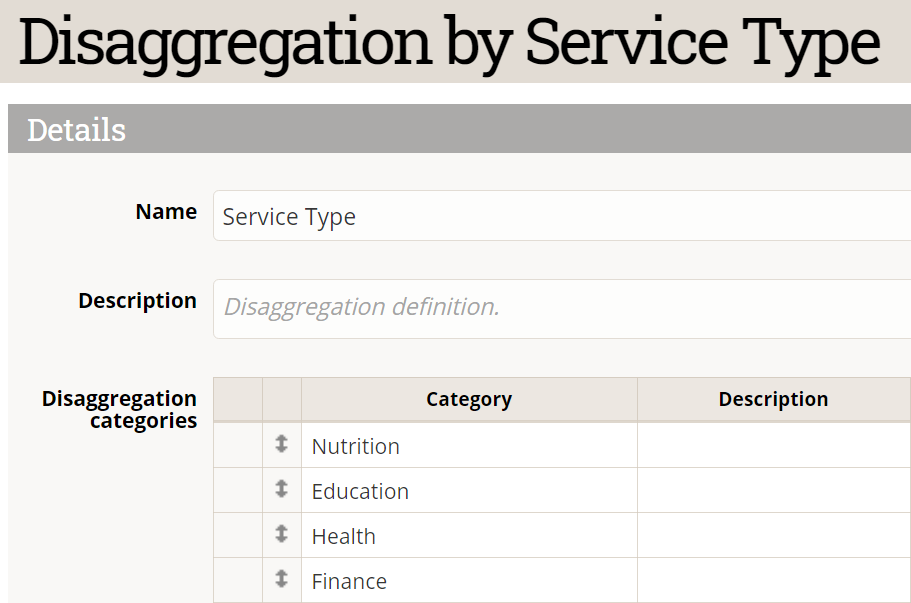
The indicator needs to count rows where the service type is equal to two of these categories, which is the same as not equal to the other two categories. Instead of filtering using the categories you want to include, filter out the categories that you need to exclude:
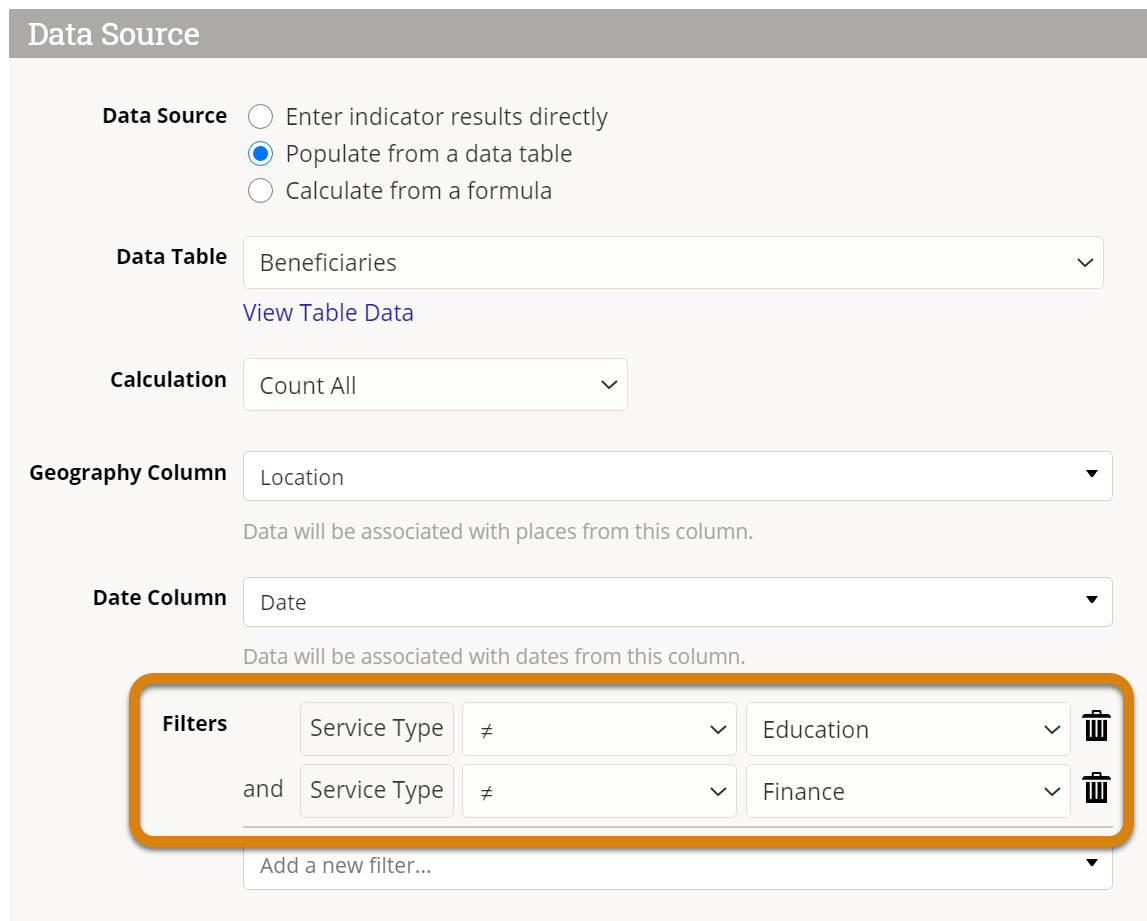
Both of these filters can be true for a single row of data at the same time. This configuration will give you the intended results: a count of clients who received nutrition or health services.
Didn't answer your question? Please email us at help@devresults.com.