MultiMatrix is a powerful query tool for organizing and analyzing data for multiple indicators. MultiMatrix works just like Matrix, but for more than one indicator. MultiMatrix reports can be saved to a list of reports or as a dashboard.
Create a MultiMatrix report
You can find MultiMatrix under the Data menu from any DevResults page. Configure the report using the options in the left-hand panel.
- The indicators section lets you select multiple indicators to analyze.
- The display section lets you choose how to slice, dice, and analyze your data.
- The filter section lets you choose a subset of your data to include.
Select Indicators
First, select the indicators you would like to include. Click on Select Indicators to choose from the indicator index.

For example, to include indicators for a single project, scroll to the Project section of the left-hand index panel and select the project. Then check the box at the top of the checkbox column to include all, and click Select. If you want to choose individual indicators, click the boxes next to each indicator.

Warning: Including all indicators for a project does not automatically filter the indicator results to just that project. This is only a tool for selecting indicators for the report. By default, all data for those selected indicators will be included in the report. To filter the report to just one project, next use the Filters section of the configuration panel after selecting the indicators.
Display
Next use the Display section to decide how to arrange your data.
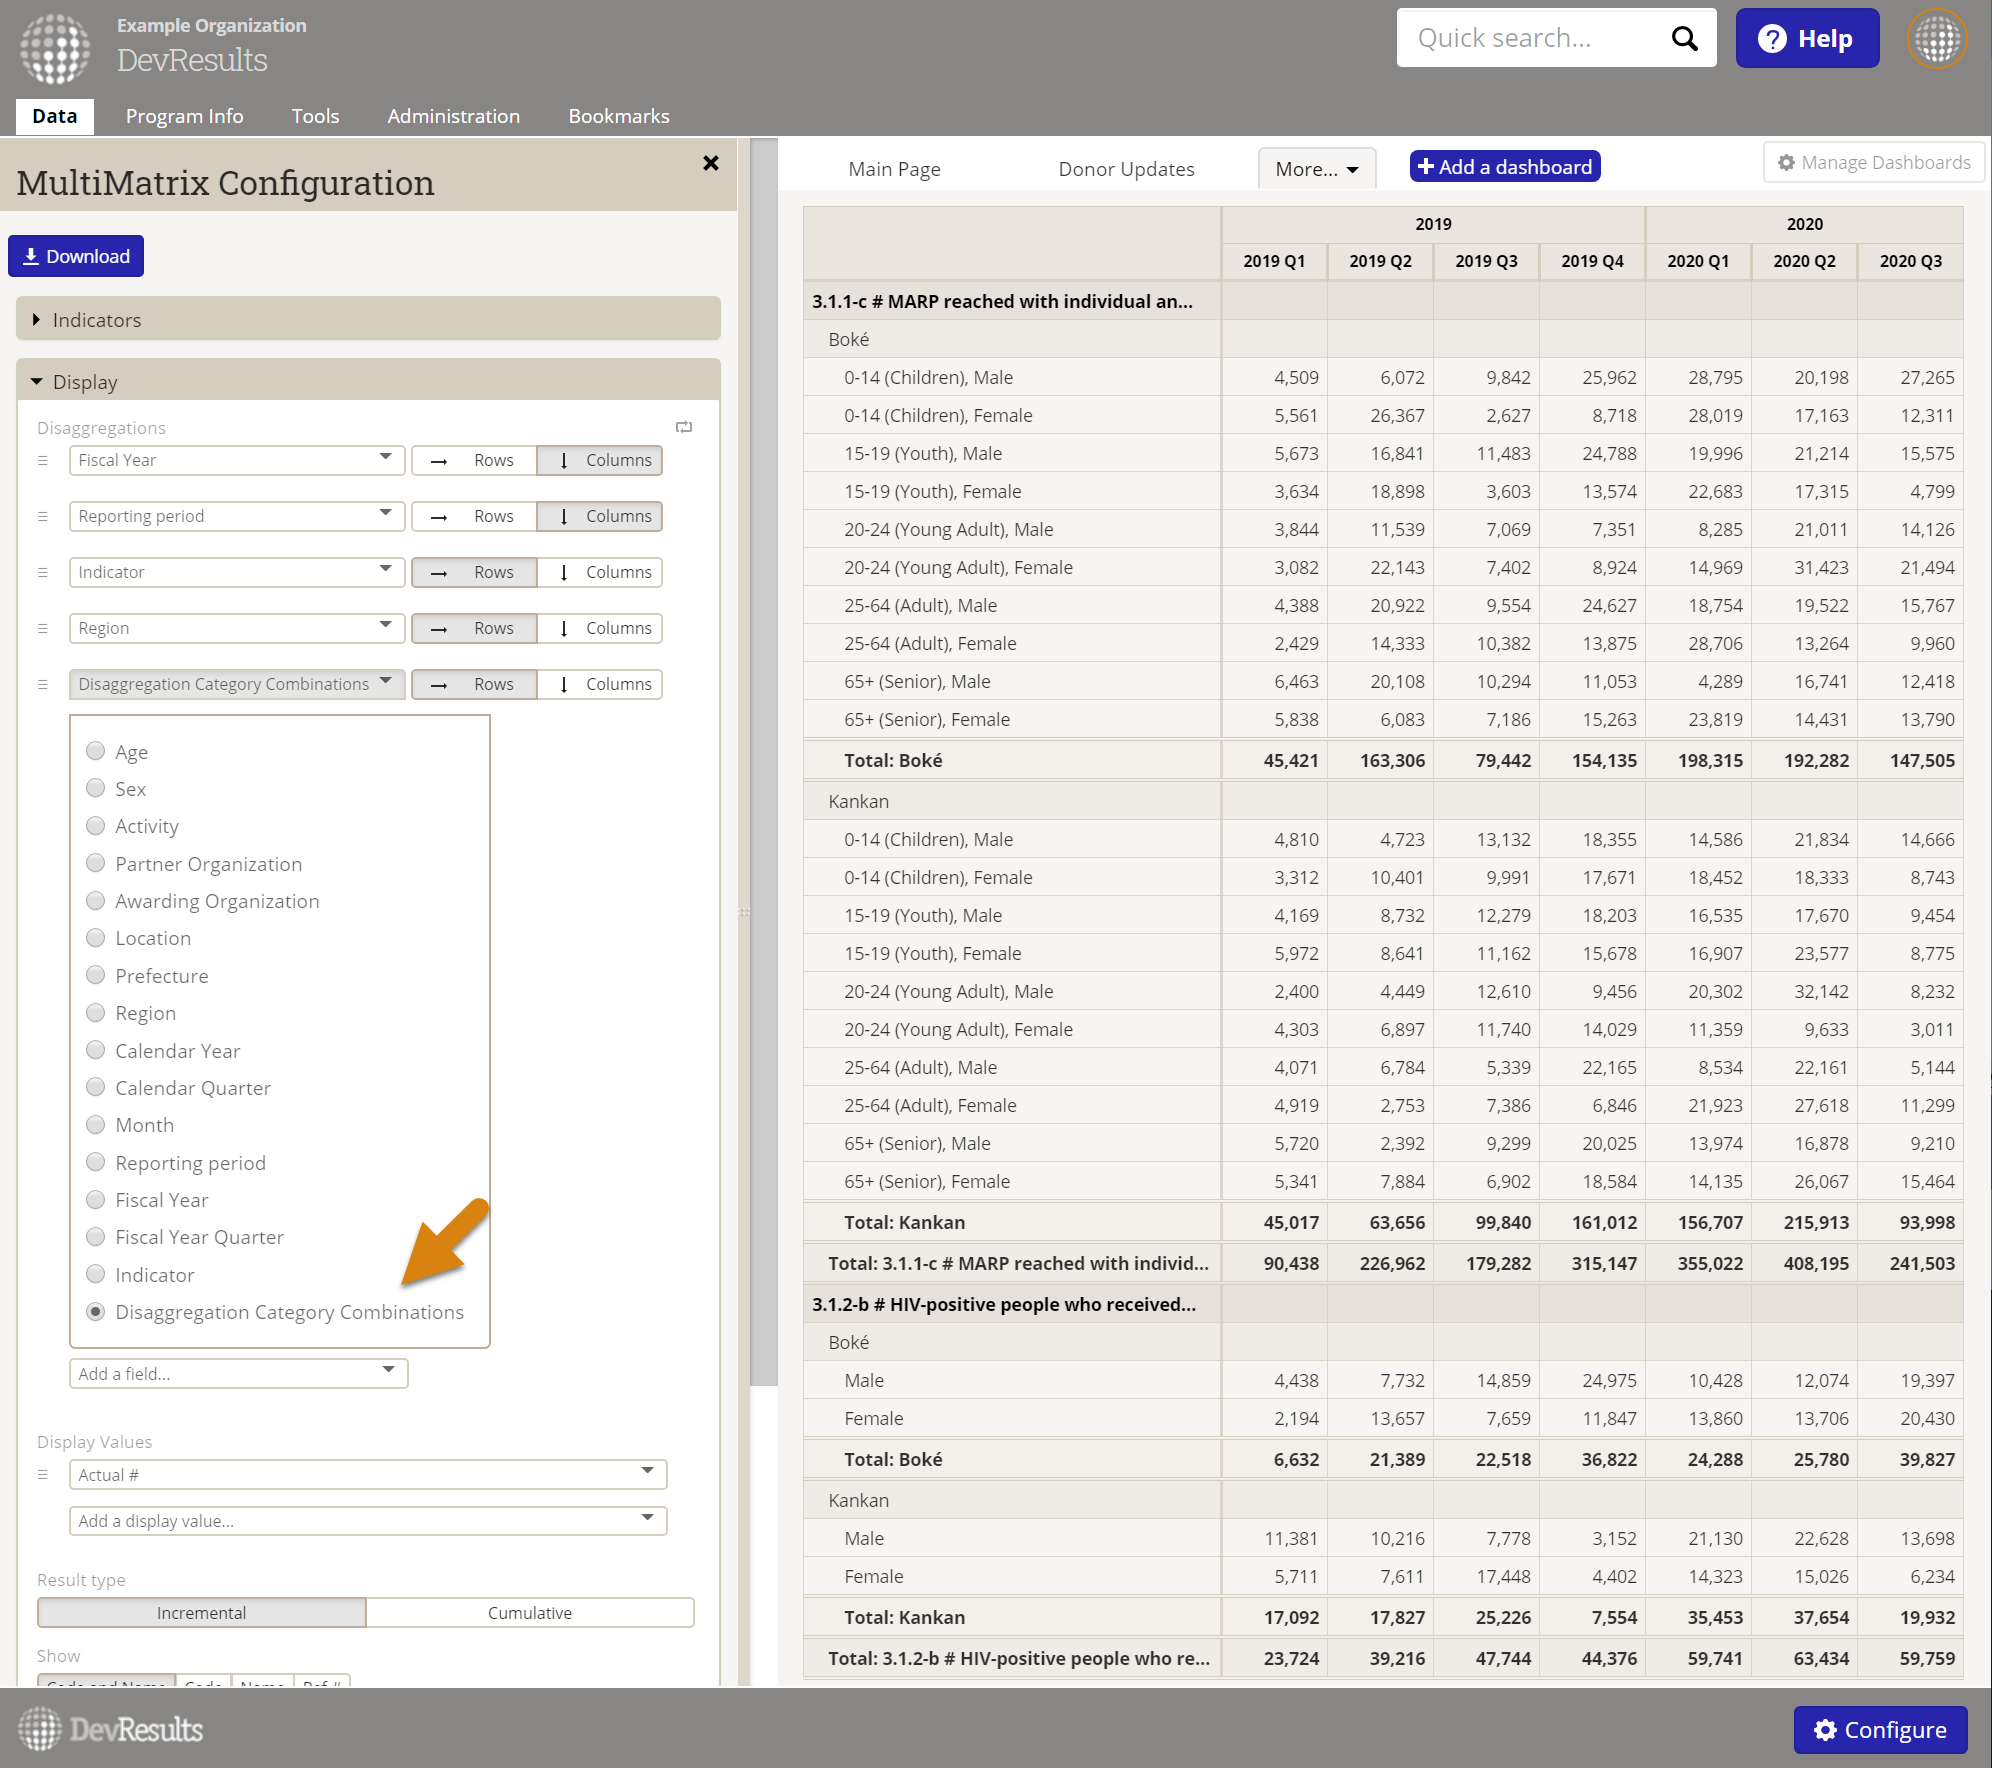
- Disaggregations: First choose how the data should be disaggregated. Arrange the disaggregations as rows/columns using the arrows next to each. Flip all the row/column selections with the arrow square in the top right.
- Display Values: Decide which values to show (actuals, targets, calculations for percent of target).
- Result Type: Decide whether results should be viewed incrementally or cumulatively.
- Show: Pick how to label the indicator(s).
- Totals: Choose whether to show/hide each total.
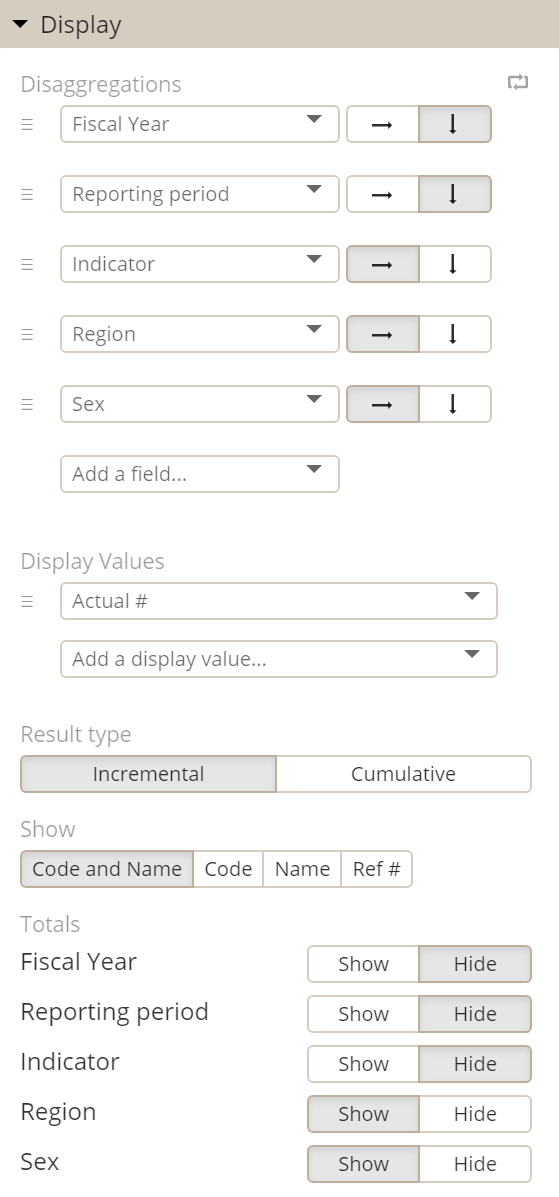
Note: To show all disaggregations in a report where indicators have different disaggregations, select Disaggregation Category Combinations.
Filters
Next use the Filter section to include data for only specific projects, organizations, disaggregations, geographies, or reporting periods.
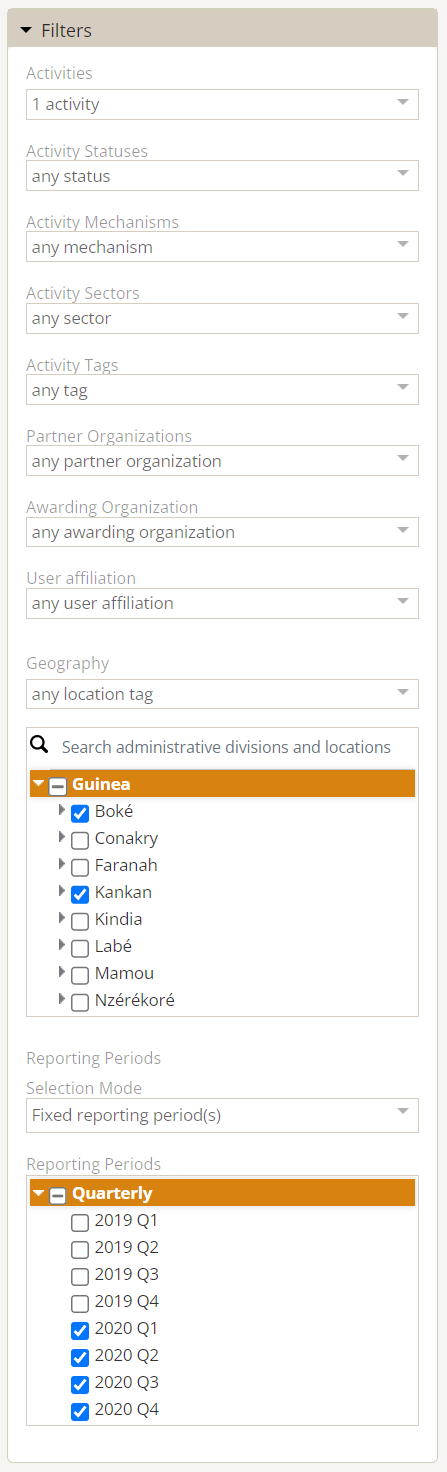
By default, reports include data for all projects for any indicators selected. To show data for just one project, you must filter the report to include only that project.

The User Affiliation filter narrows results to only the projects that the report viewer is affiliated with. For example, if you filtered a report to "User has bookmarked projects" and then shared it with another user, it would show results for the projects that were bookmarked by the new report viewer, not the report creator.

To select individual reporting periods, the Selection Mode must be Fixed reporting period(s). If the Selection Mode is set to choose the reporting period automatically, selection of individual periods is disabled.

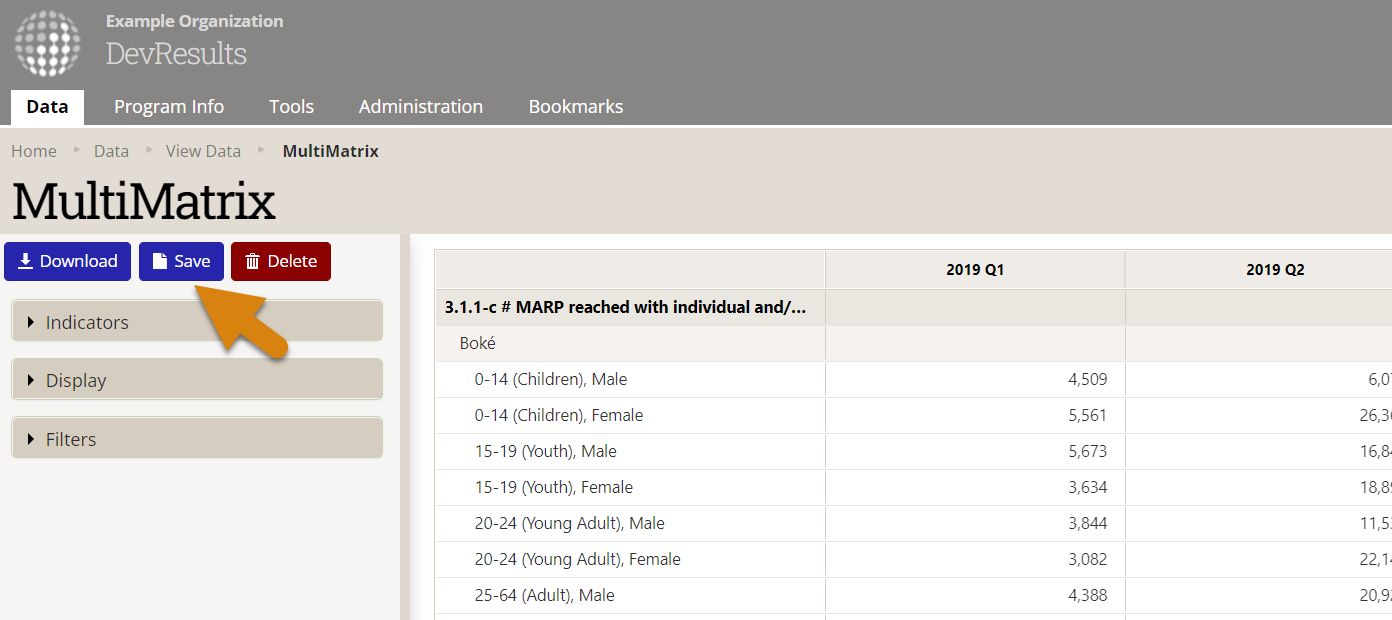
Save
Save your report by clicking Save, giving it a title, and clicking Save again. Here you have the option to save it as a report or as a dashboard. To find your saved reports, go to Data > Saved reports.
Saving your report gives it a unique URL that you can give to anyone who has access to see that page. URLs saved reports contain ID numbers, like yoursite.devresults.com/en/dash/viewdata/results?savedreportid=2126. A link without an ID will take someone to MultiMatrix, but they won't see your report.
Create a MultiMatrix dashboard
There are two ways to create a MultiMatrix dashboard. One option is to follow the directions above, but choose Save as dashboard at the end.
The other is to go to your Dashboard and select the +Add a dashboard button. Select MultiMatrix under Type. Give your dashboard a title and an optional description.
As with any dashboard, you can elect to make the MultiMatrix dashboard available to others or private. Owners can choose to push MultiMatrix dashboards to other users. 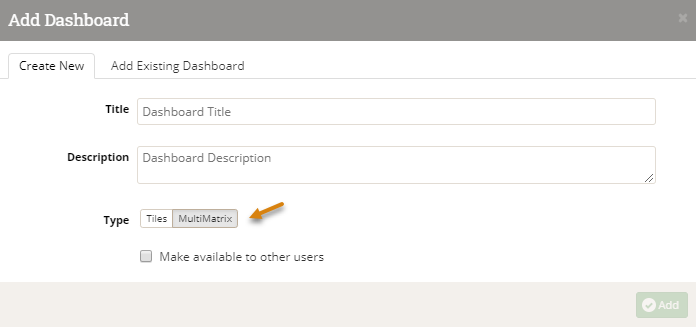
Once you have created the dashboard, you can configure your MultiMatrix report. If you ever want to make changes to your MultiMatrix dashboard, click Configure in the bottom corner.

MultiMatrix for partners
Check out our quick how-to page for partners.
Partner users can use MultiMatrix to assemble reports and view their data. Partner users can create MultiMatrix dashboards, and owners can push MultiMatrix dashboards to users. For partners, all indicator data and program information is automatically filtered to just what the user has access to. There's no way for a partner to see data that doesn't belong to them, even if someone pushes a dashboard to them that has other projects' data. We filter it out automatically!
Partner users can also follow the same instructions in the dashboard section and use all the same configuration options in the create a MultiMatrix report section.
Didn't answer your question? Please email us at help@devresults.com.