There are several ways to add or view indicator results. This page describes the best place to edit or review indicator results (or an activity's data entry status) for a particular reporting period.
Both options require navigating to an Activity Reporting Period page. To do so, go to the Data menu and select "Per Reporting Period" under the options to Enter Data.

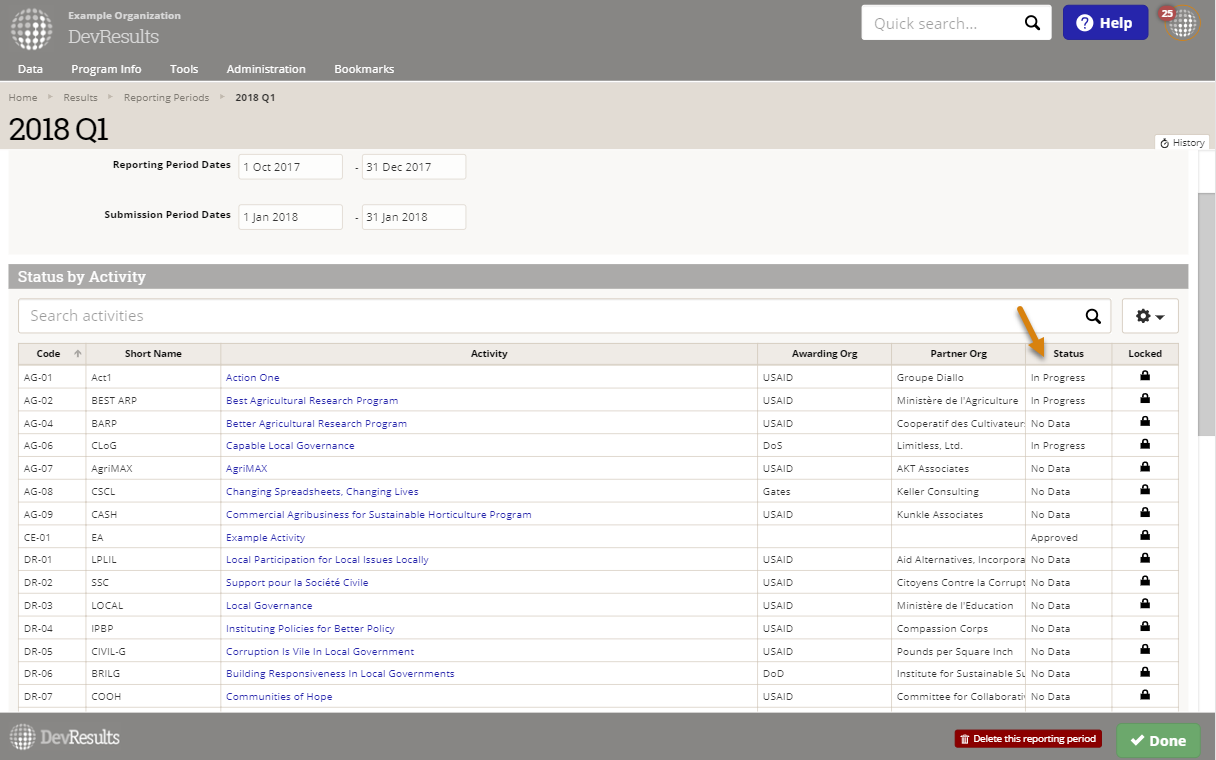
Click on the reporting period you would like to enter data for.

You can see the data entry status for all activities that are assigned indicators for this reporting period. This column will say "No Data", "In Progress", "Submitted", or "Approved".
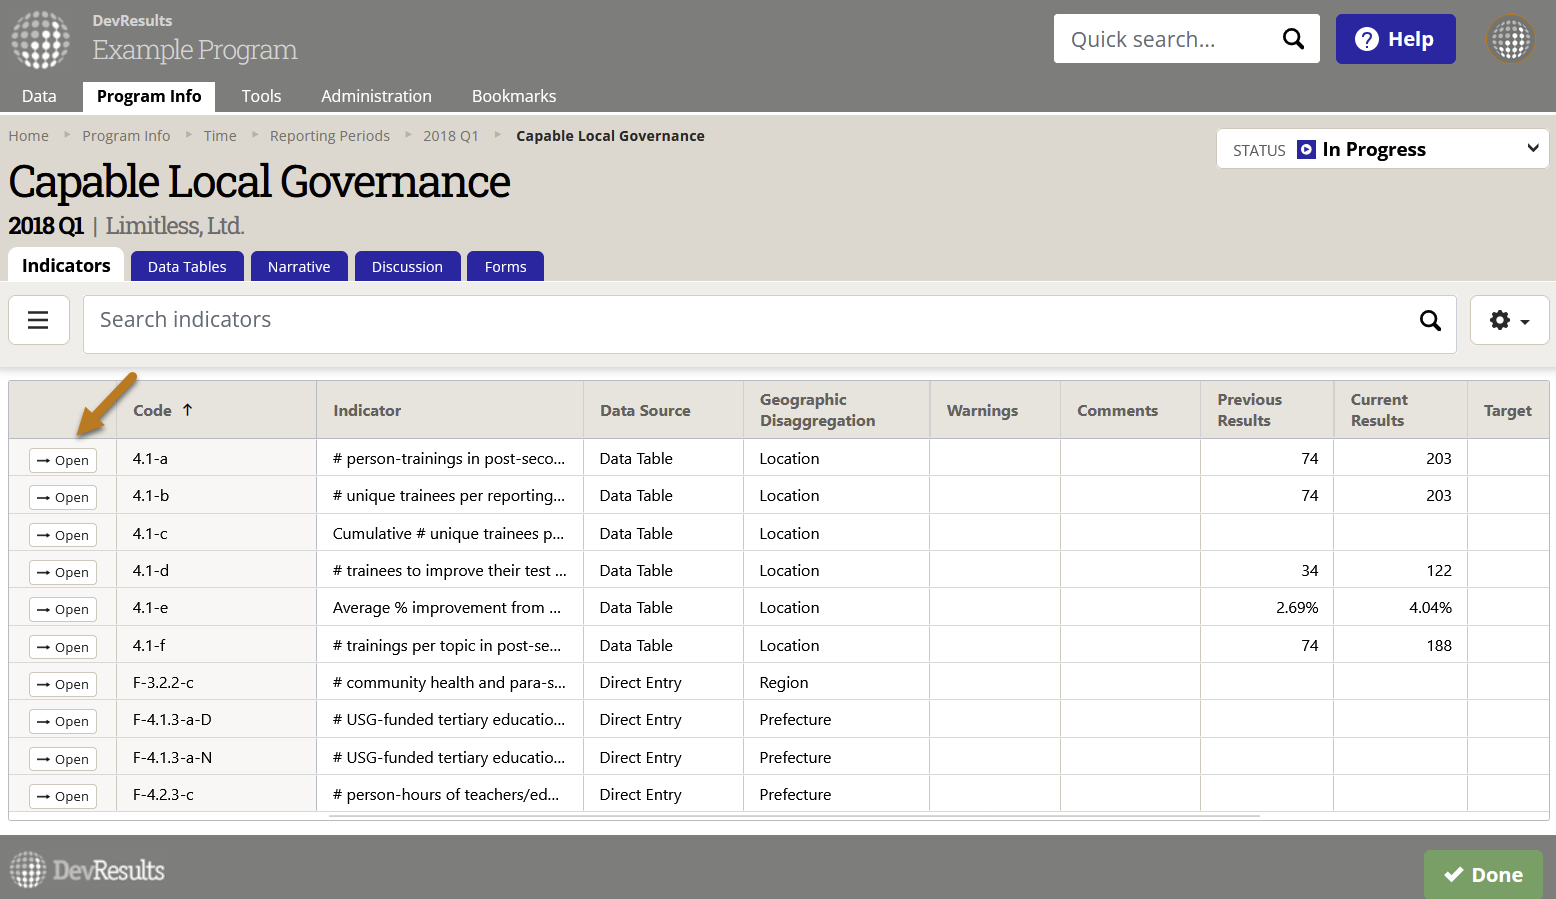
Click on one activity.
 This page will show all the indicators assigned to that activity for this reporting period. You can view the total of the results entered to date under "Current Results".
Enter Data Online
Click on a single indicator.
This page shows the geographic and demographic disaggregations required for the indicator (if any). Totals are generated automatically. You can click on a single cell to add or edit data. The far right column provides the opportunity to add narrative comments for each geographic disaggregation.
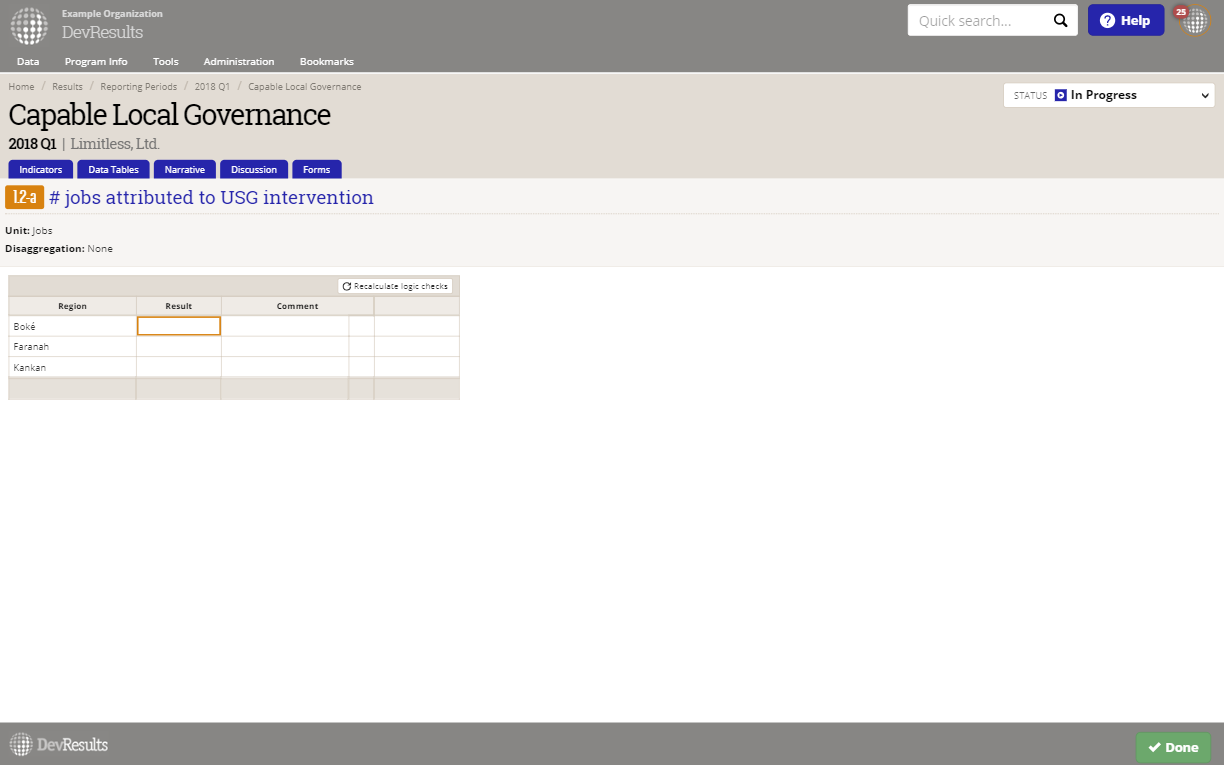
If no rows appear on this page for data entry, check on the geographic areas of focus for that activity.
Enter Data Offline (via Excel)
On the Activity Reporting Period page, click on the gear icon and select Download results template.
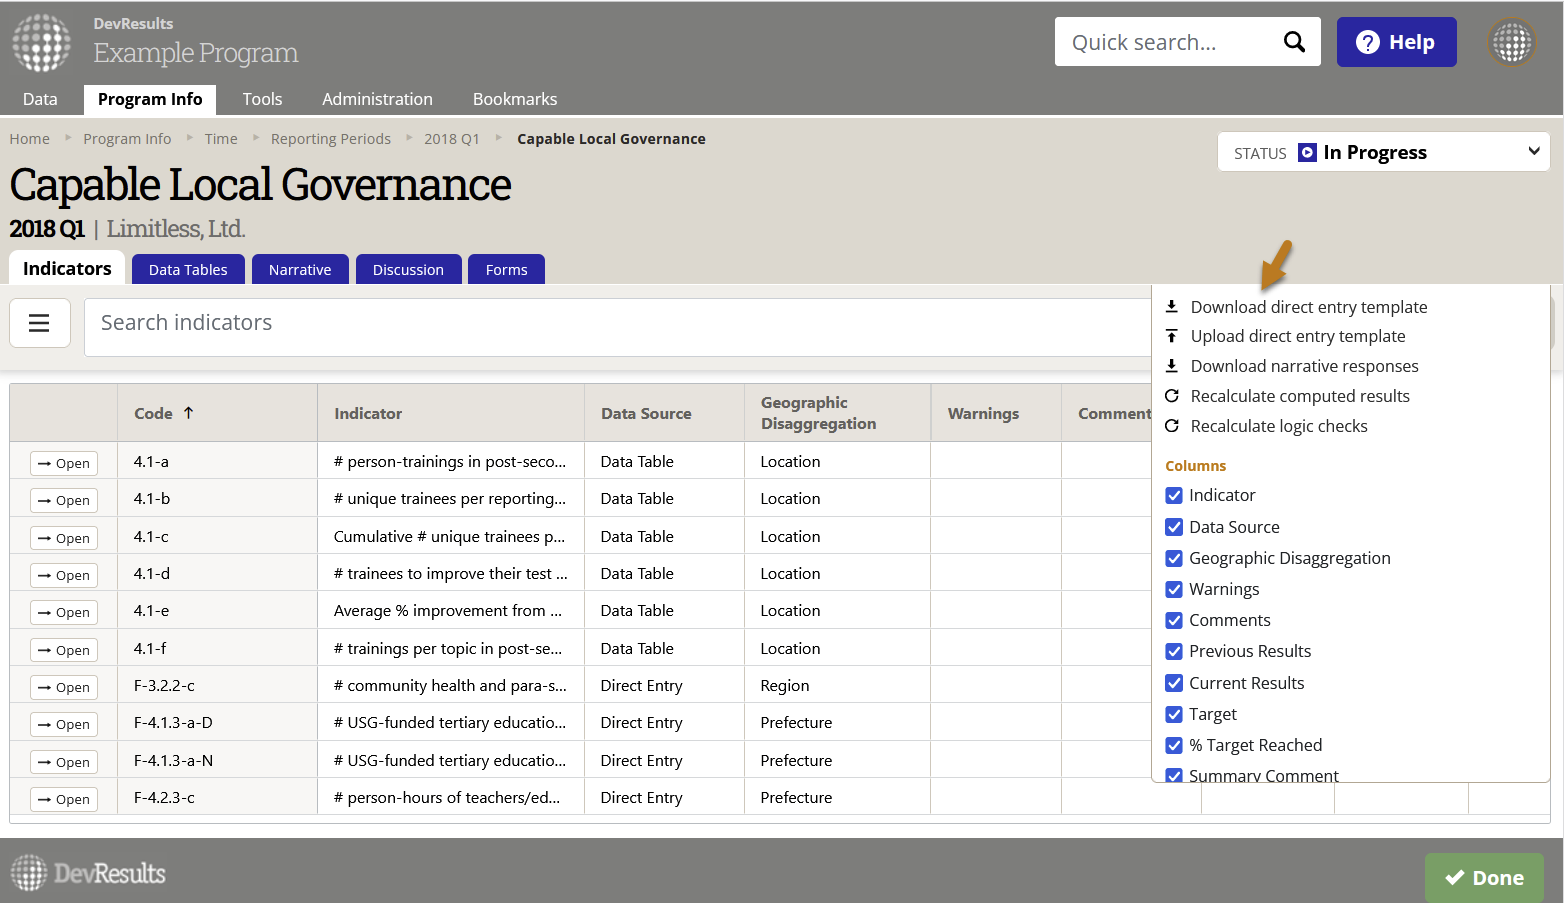
In the popup window, make sure all technical areas are selected if you want to report on all of your activity's indicators. Otherwise, check the boxes for just the indicators for which you want to report results. Click Download. This downloads an Excel file to whatever folder your computer uses for downloads, such as the Downloads folder or your computer's Desktop.
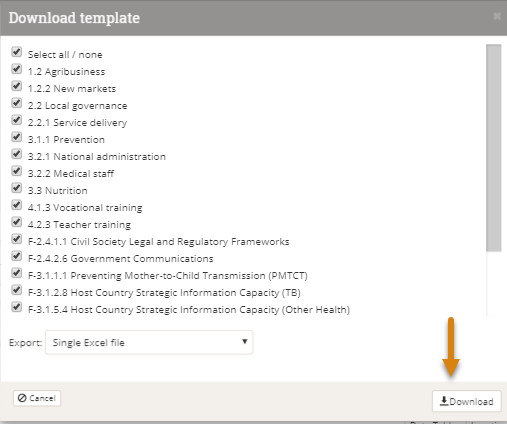
Tip: If you would prefer a separate template for each location or administrative division where you report data, you can click on the Export dropdown and select to export separate files for the geographic disaggregation of interest. This will download a zipped file with templates for each location or administrative division (like province or district). When you've collected the completed templates, put them back into a zipped folder (you can change the names of the files and folder) and then upload the zipped folder.
Fill out the Excel template like any normal Excel file. You can change the name of the file, but the file will not let you change the row or column headings.
Fill out the Excel template like any normal Excel file. You can change the name of the file, but the file will not let you change the row or column headings.
- NOTE: Your spreadsheet may have multiple tabs for each geographic disaggregation for each technical area.
- In each tab, the rows show the places (location/district/region/etc.) where you should report indicator results.
- The columns show the indicators (plus disaggregations) that your activity should report. There is a column to enter comments for each indicator for each place.
- You do not need to enter any totals for an indicator's disaggregations or geographies. DevResults does this automatically.
If any of the places where you need to report indicator results do not show up, you might need to:
- Define a location
- Assign a geography to an activity
- Check the configuration of activities to reporting periods to technical areas to places
If any of your indicators do not show up, you might need to:
When you're ready to upload your data, click on the gear icon and then Upload results template.
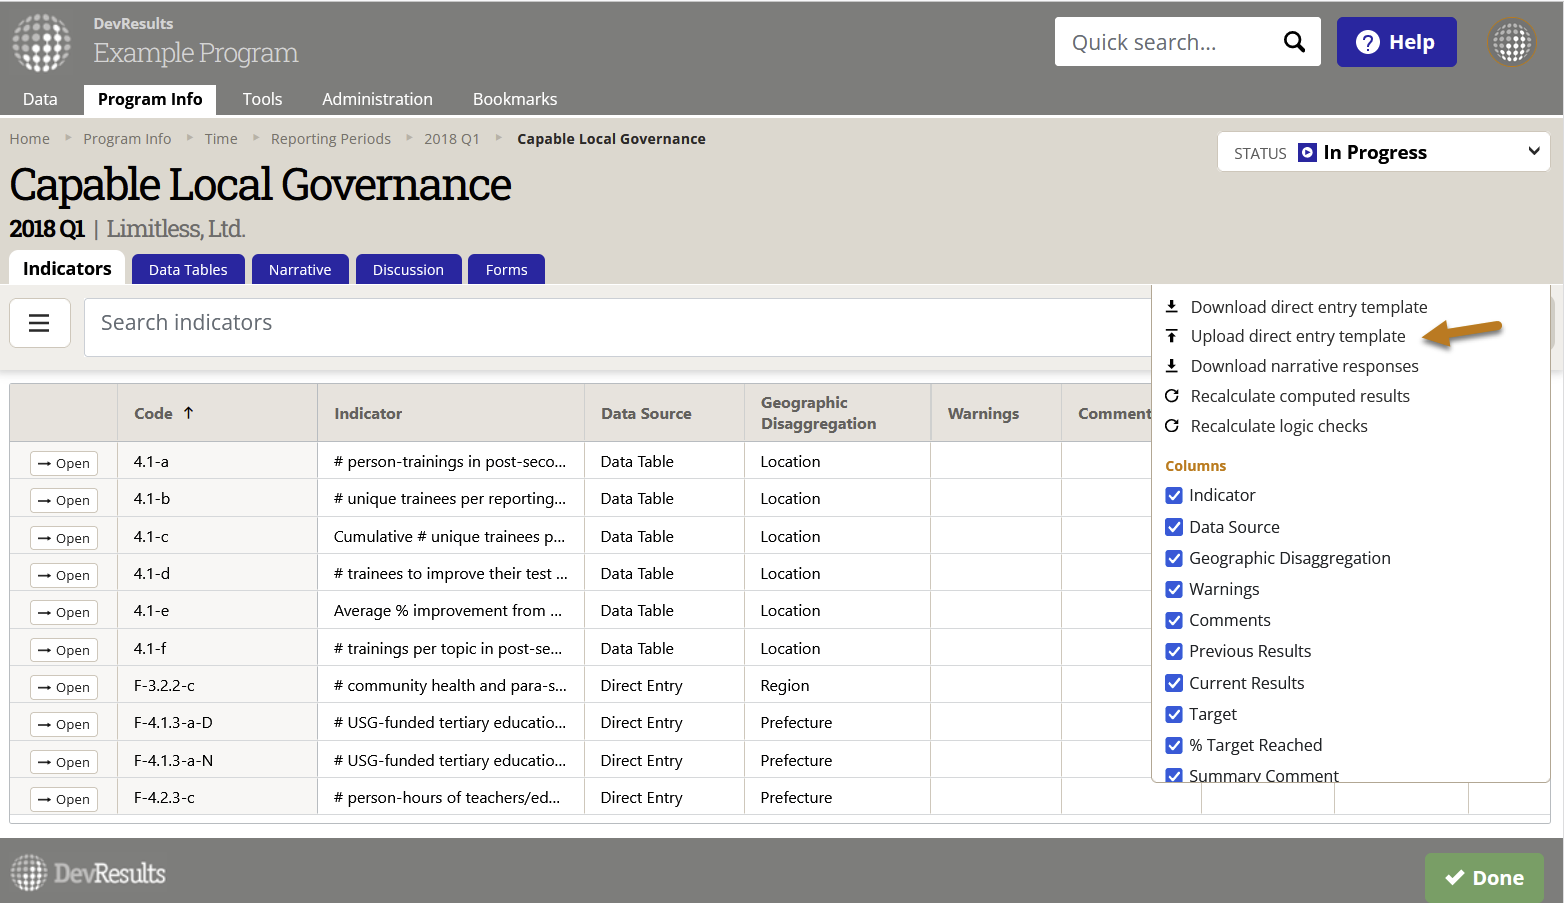
Select the file from your computer's folders and then click Open. You will now see a pop-up menu showing you that the system is importing and validating your spreadsheet. When it is done, you can click Done. All indicator results are now stored online. You can view totals on your activity reporting page or click on each indicator for details.
Didn't answer your question? Please email us at help@devresults.com.